In the field of data science rolling out a machine learning model is a stage that enables individuals to engage with your model and receive predictions according to their inputs.When it comes to this blog post we’ll delve into the process of developing a Streamlit application that smoothly combines with a trained machine learning model.This manual will guide you through every stage of the procedure guaranteeing that you can construct an application that’s both efficient and easy for users to navigate.
Understanding the Setup
Before diving, into the creation of our Streamlit application it’s crucial to review the groundwork laid out in the video session we had together. In our work we’ve crafted a machine learning model. Saved it using Pickle—this model forms the core of our upcoming application. The aim of our Streamlit app is to provide a platform for users to input attributes and get predictions based on these inputs.
Reconstructing the Input
To start developing our app we need to organize the data used for training our model in the stage as it is essential for the model to receive inputs in a predefined format and sequence. To accomplish this task we will establish a function that collects all the required attributes that users are required to enter.
Lets consider a scenario where we include attributes, like power output (in horsepower) torque rating (in pound feet) brand name (make) and physical dimensions (body size). In our application interface design process we’ll incorporate data entry fields for these attributes. For horsepower data entry we will implement a numerical text box enabling users to specify values ranging from 0, to 1000. By default the initial value will be pre set at 300.”
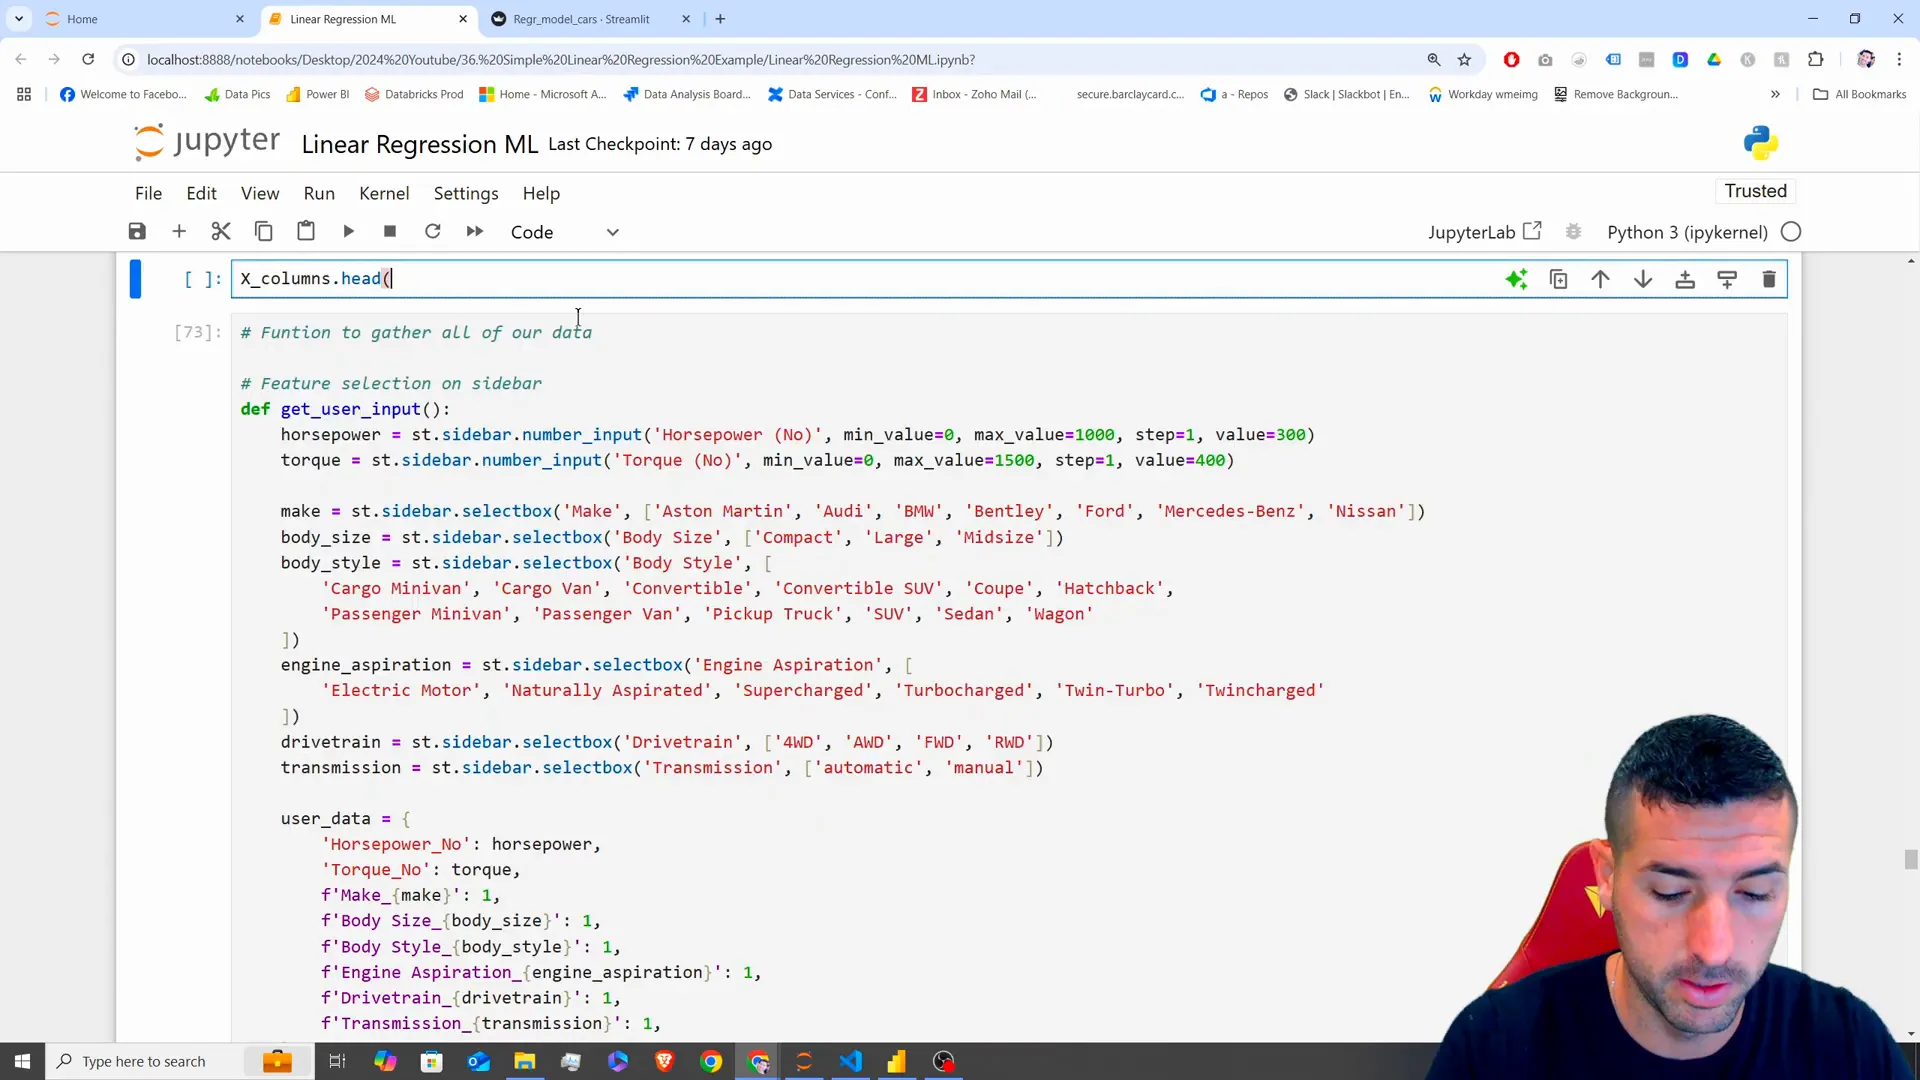
We plan to add input sections, for torque and the categorical traits, like brand and body size so that users can pick options from lists effortlessly for a user friendly app experience.
Transforming User Inputs
After collecting the information from users’ the following task is to convert this data into a form that our system can understand by encoding the users choices into a format.
When a user chooses “Audi ” our conversion process changes it into an array, with “Audi” as 1 and the other choices as 0.This is crucial for the model to recognize which features are, in use according to user selections.
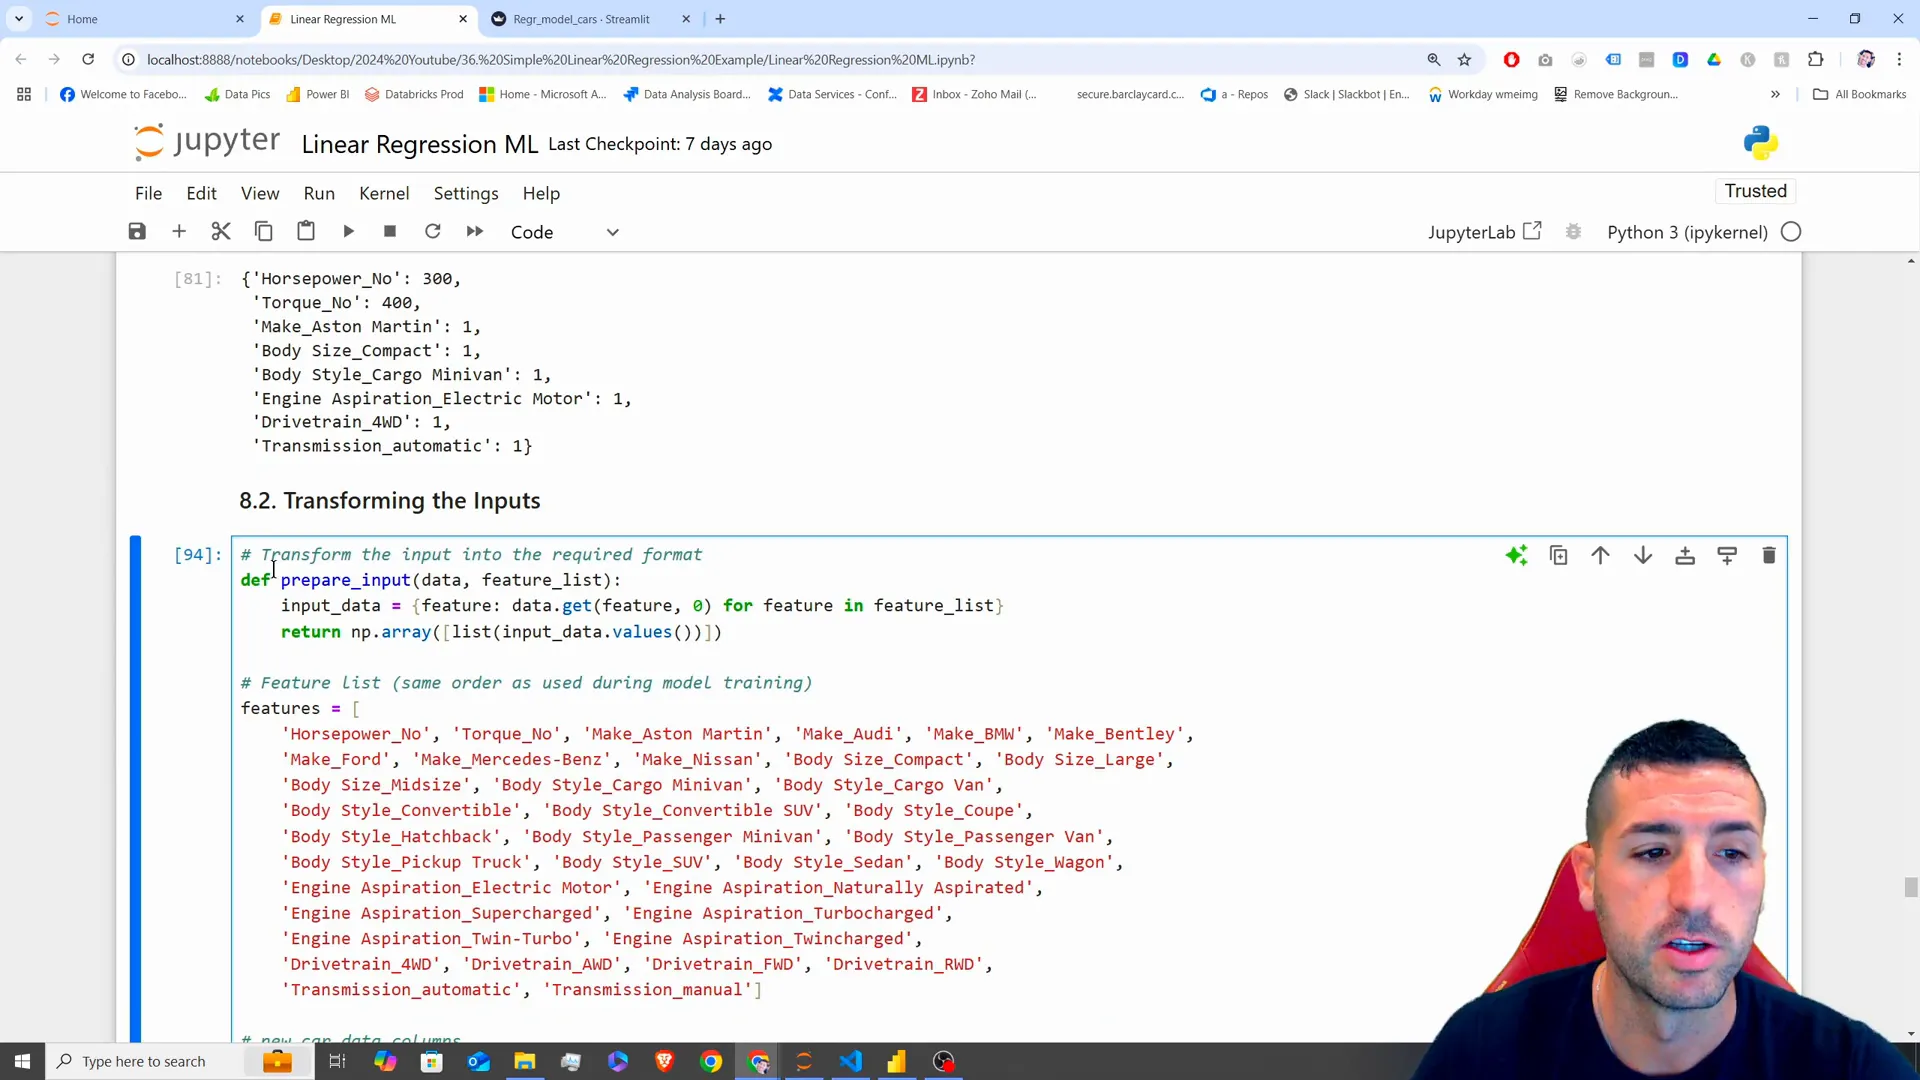
The conversion process involves iterating over the list of features. Filling in the input array accordingly to prepare a organized input, for the model to make predictions with.
Making Predictions
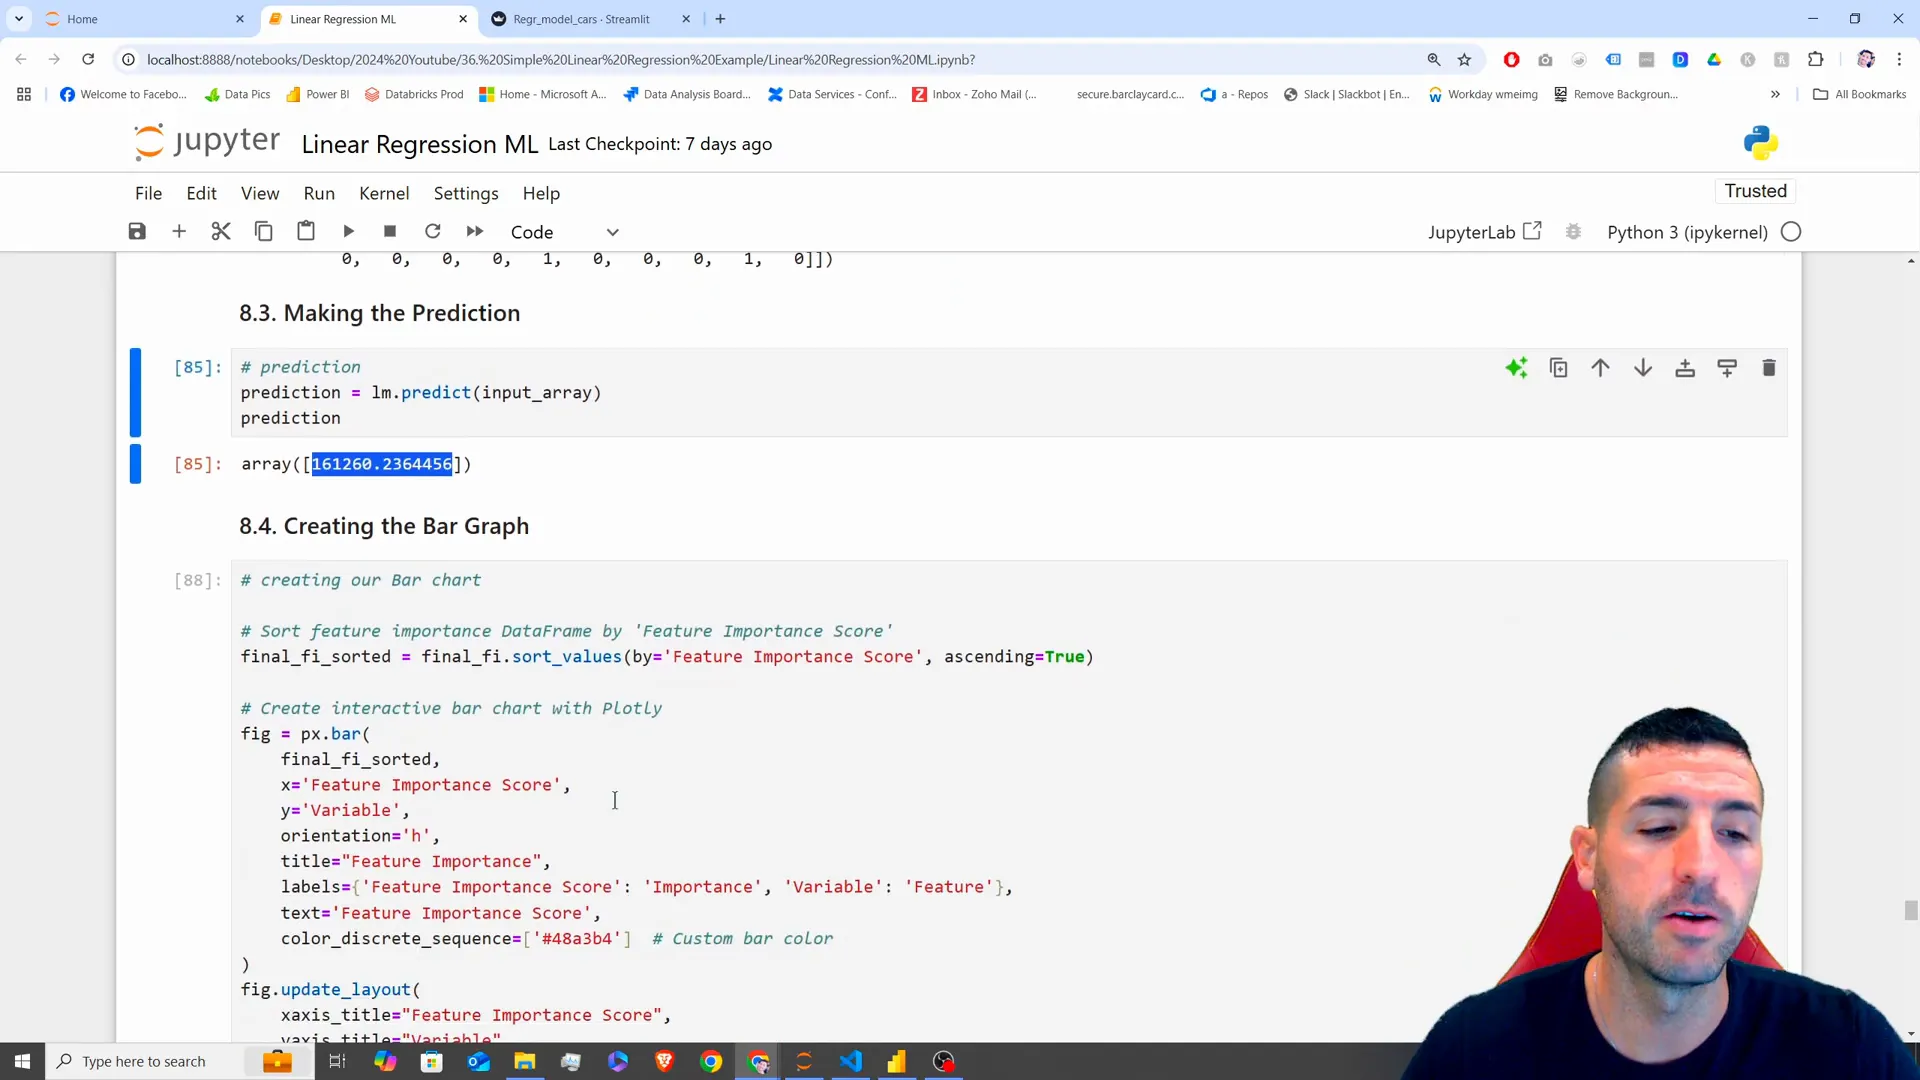
Once we’ve processed the information and completed the transformation stage successfully we’re ready to utilize our trained model, for making predictions. By executing the function on our model and providing the modified input array as an argument we can produce a prediction that align with the choices made by the user.
The forecast will be shown in the application, for user feedback according to their input data.Test the feature to confirm the model is appropriately integrated and predictions are precise.
Visualizing Feature Importance
In order to improve the user experience of our app further we could also incorporate a representation depicting the importance of each feature. This display will highlight the features that heavily influence the models predictions.
Lets utilize Plotly to craft a bar chart illustrating the significance of features, in our models predictions.This interactive graph empowers users to delve into the impact of features, on our applications functionality and insights.
Building the Streamlit App
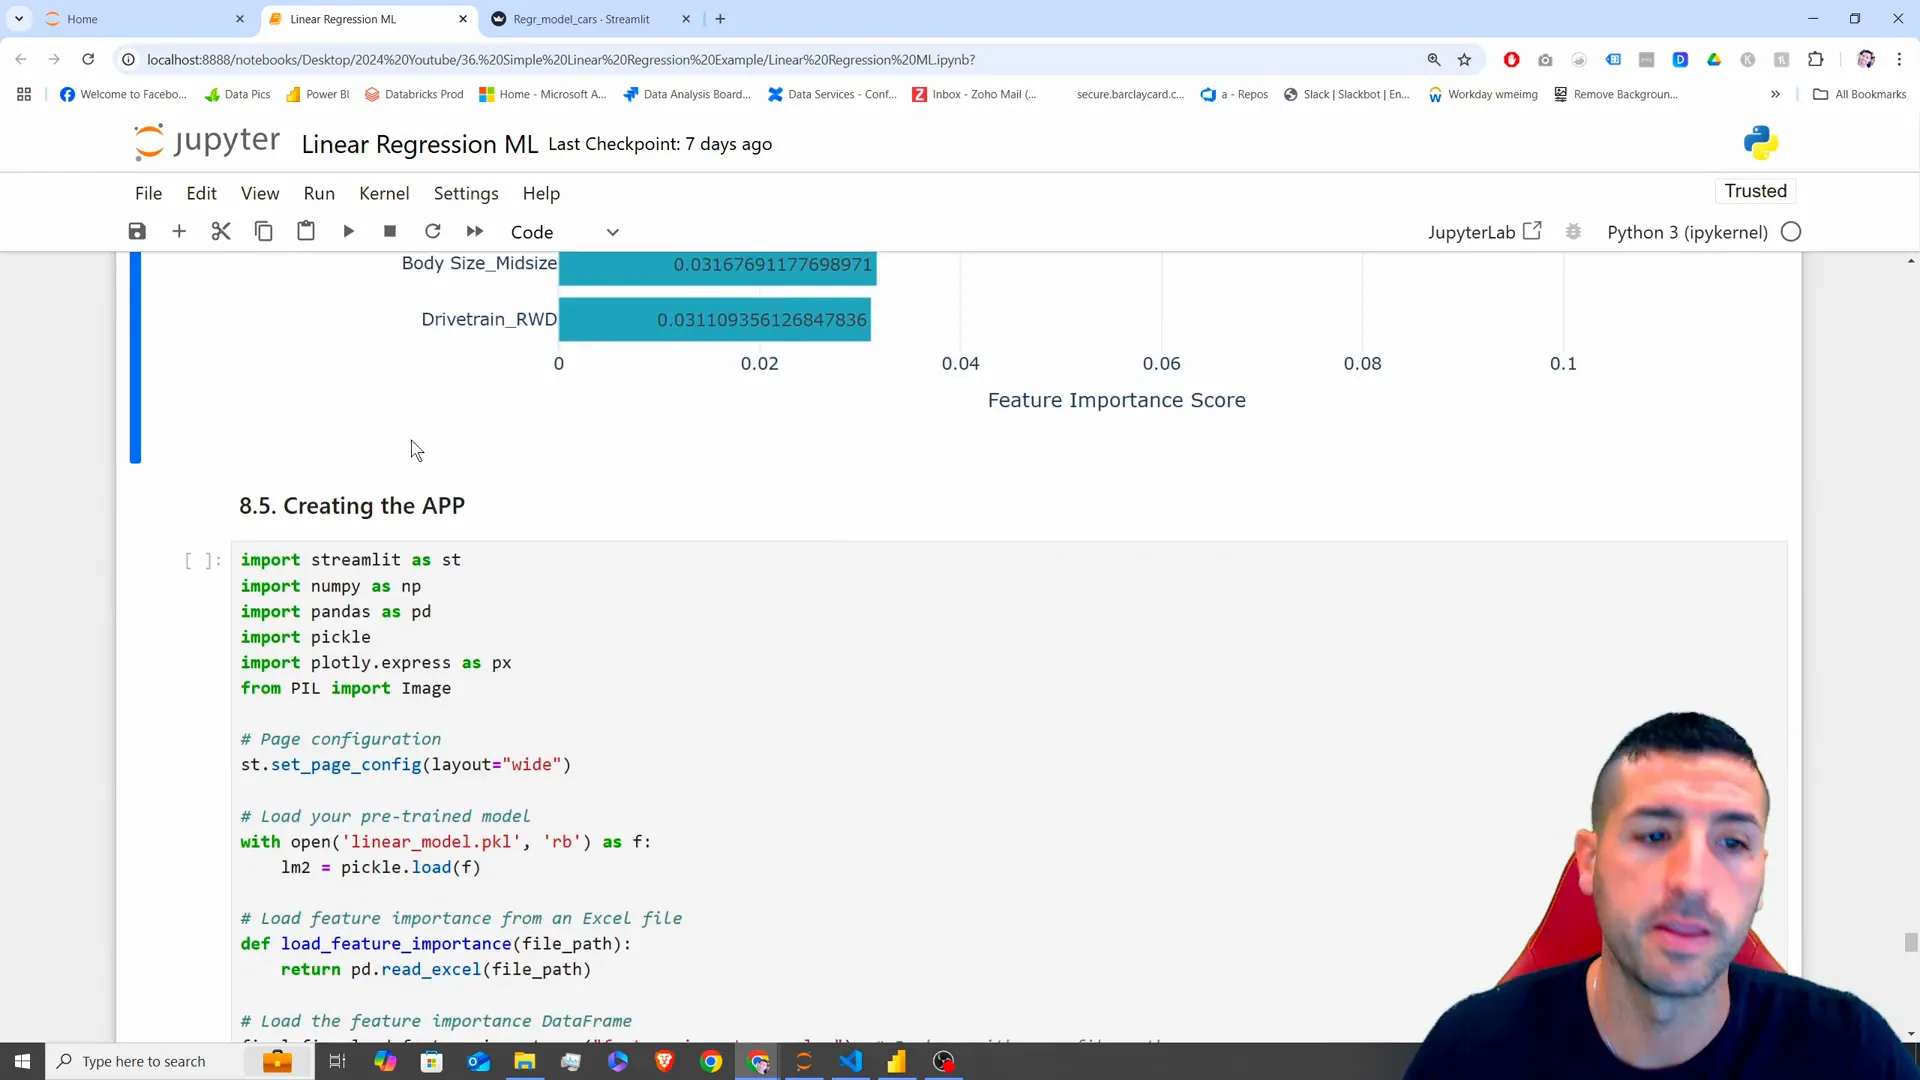
Now that we have outlined our data collection methods and tools, for analysis and presentation, in place it’s time to combine them all in a Streamlit application. We’ll start by bringing in the required libraries and configuring the layout of the page.
Now we’ll import our model thats been trained previously from the Pickle file and the important features, from an Excel file into our system setup.The side panel will feature fields for user input along with a captivating image header and the central title of our application, on the webpage.
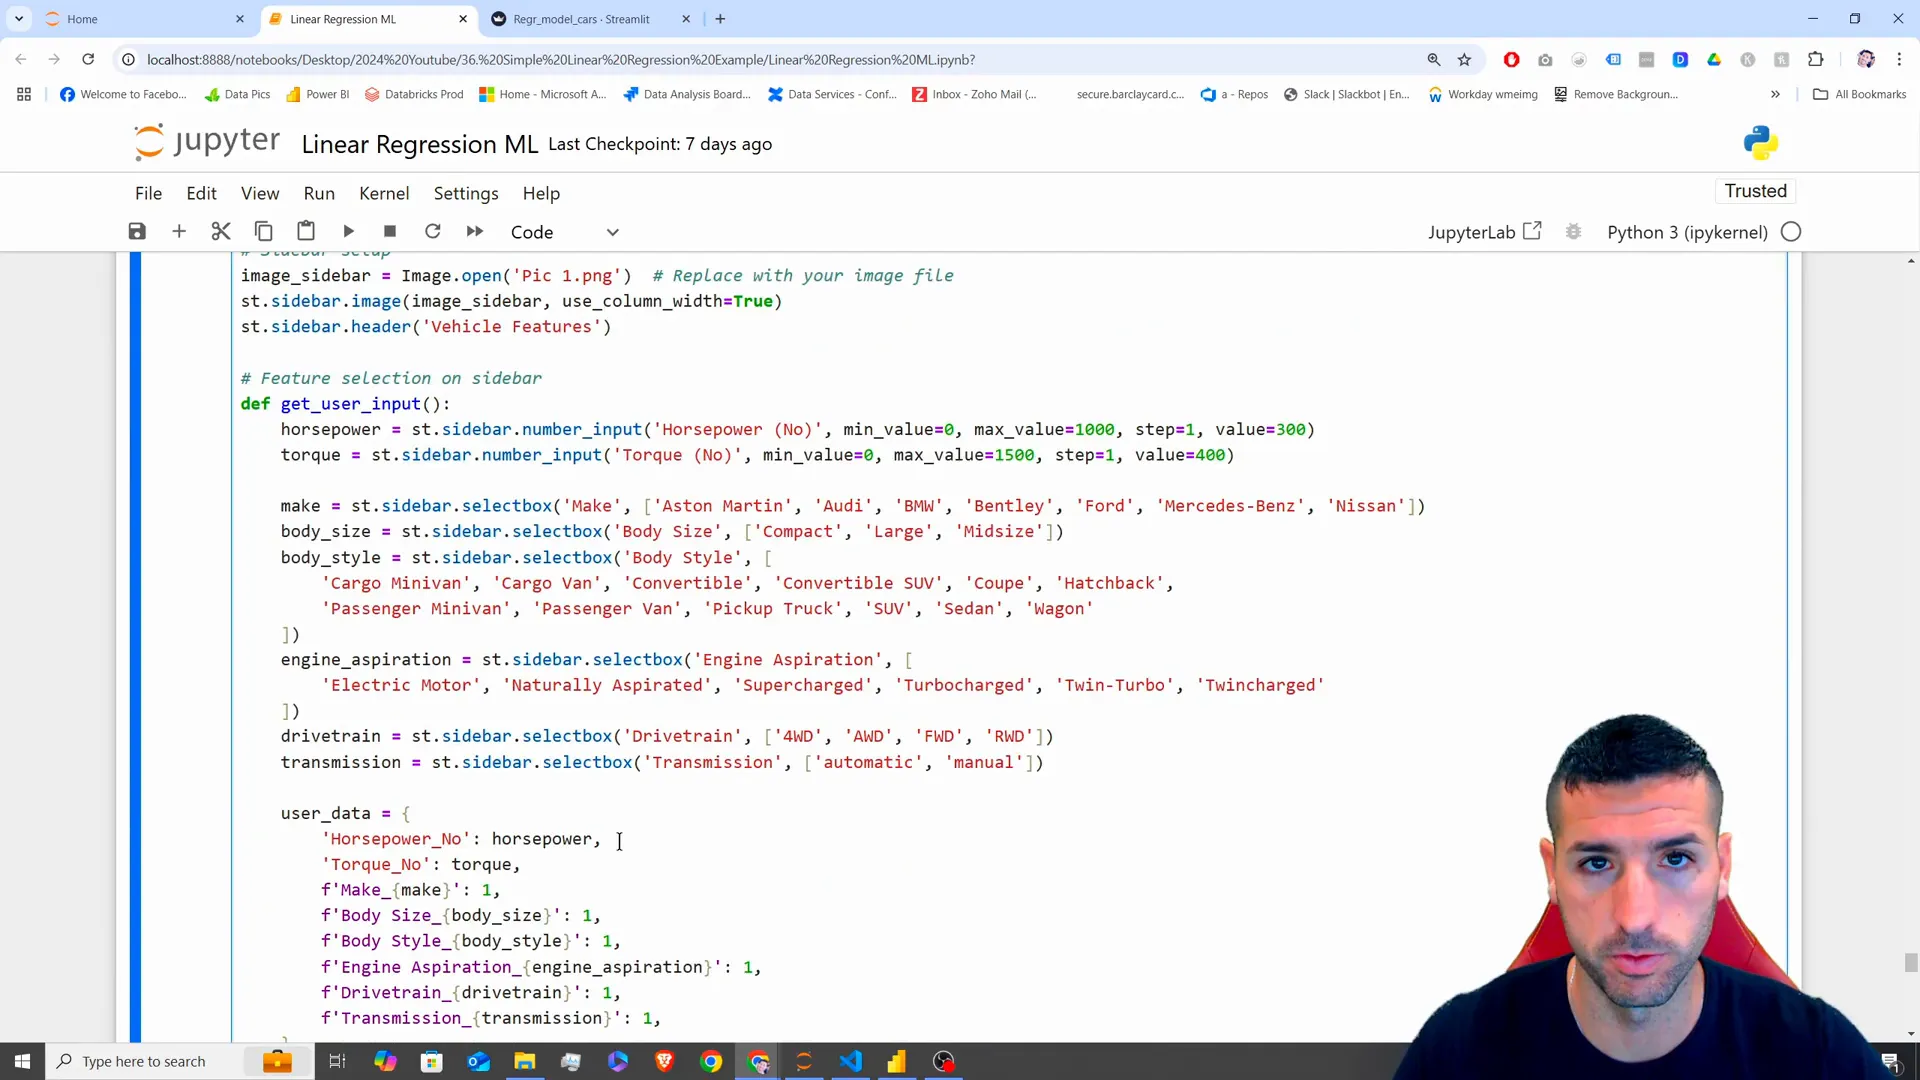
Once we have set up the design structure in place we’ll make two columns. One for users to input information and the other for showing predictions. This arranged format will improve user interaction by making the application easier to use and visually attractive.
Running the App
To run the Streamlit app, we will need to execute a command in the terminal. After navigating to the directory containing our app file, we can run the command streamlit run app.py. This will launch the app in a new tab in our web browser.
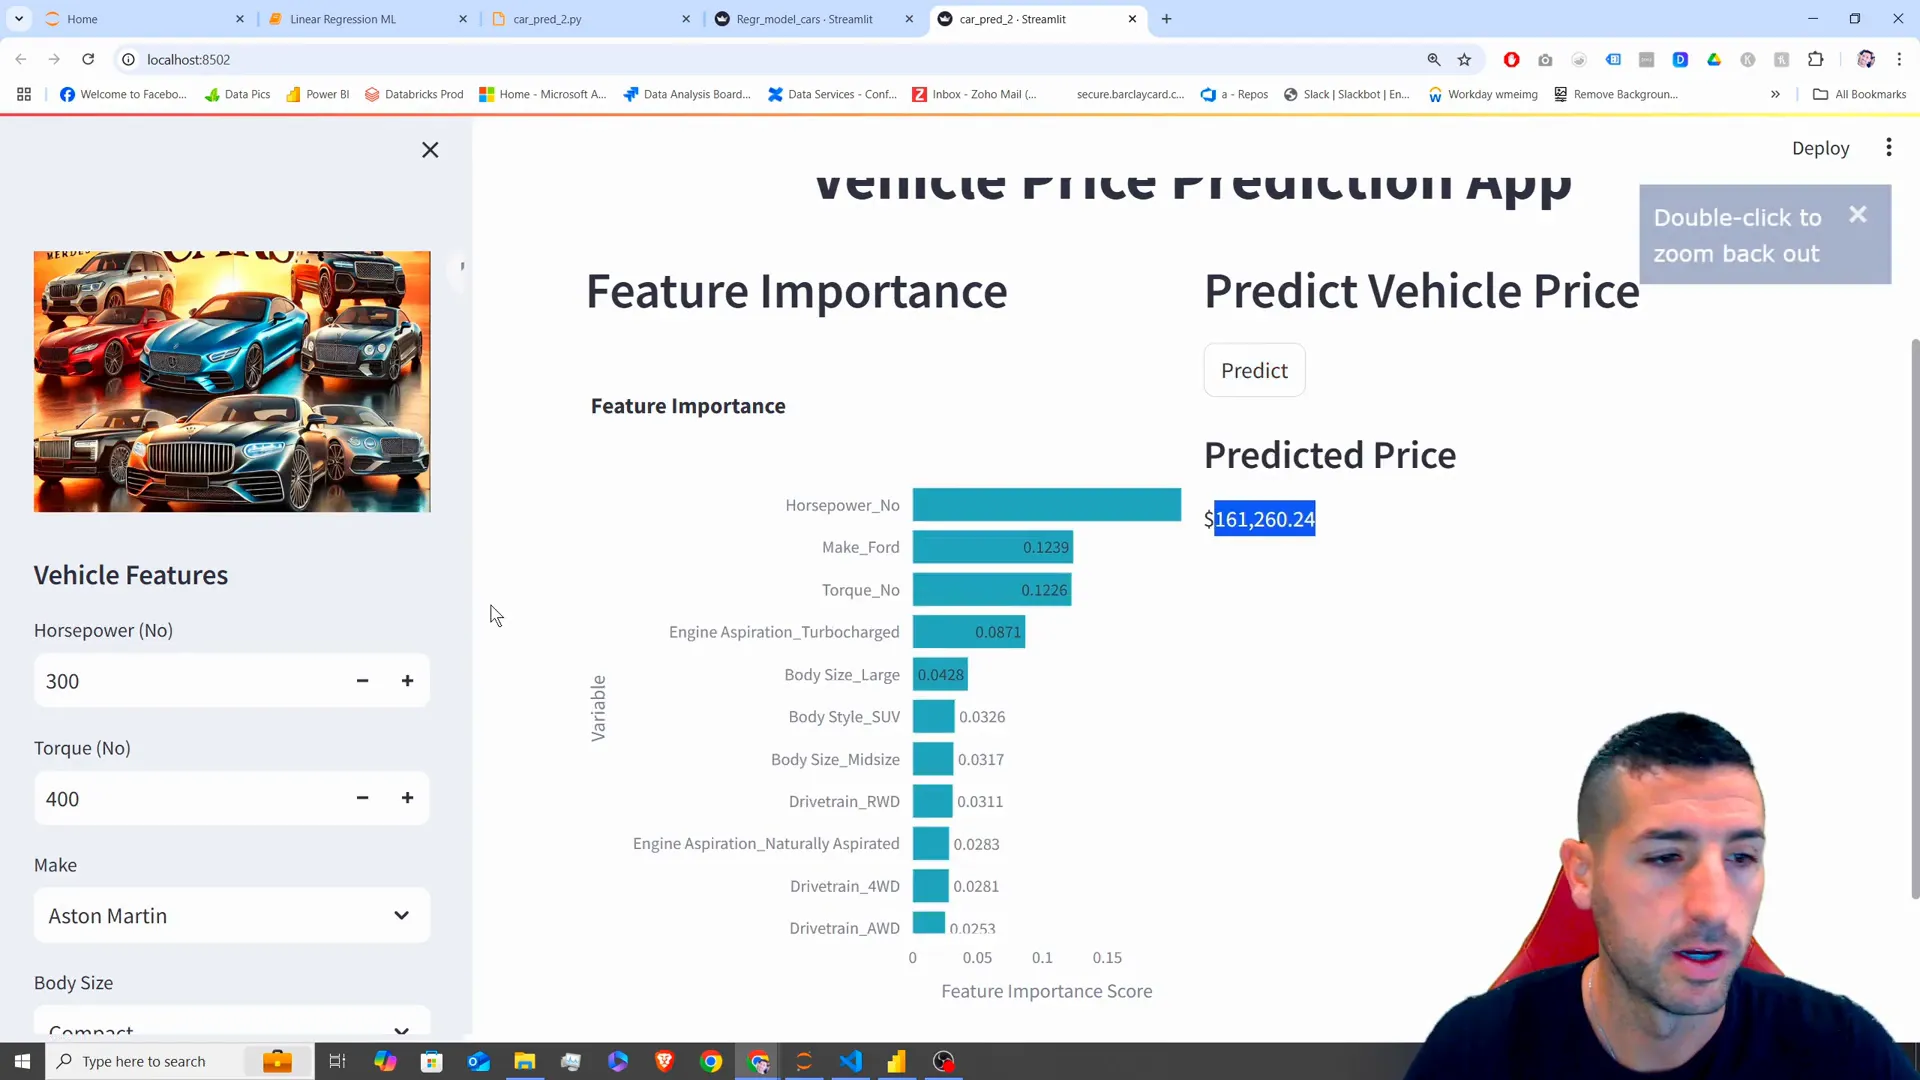
Once the application is up and running smoothly for us to use it practically by entering data points and pressing the button for obtaining results based on our choices to showcase how well our model works in real world scenarios.
Conclusion
In this article we delved into the steps involved in setting up a machine learning model as a Streamlit application.In this article we delved into the steps involved in setting up a machine learning model as a Streamlit application.We achieved this by reshaping inputs augmenting them with predictions and showcasing the significance of features through visualization.This resulted in a program that enables users to interact directly with our model.
In the video presentation we plan to expand on this idea by creating a Power BI dashboard that showcases our predictions from the model in conjunction, with the data available to us.This will offer insights and analytical tools, for companies seeking to incorporate machine learning into their activities.
If you found this guide useful and enjoyed it please give it a like. Consider subscribing for articles, on data analysis and machine learning !
Feel free to explore content by watching the videos from this series.
Connect with me on X for updates and more insights!
