Excel is a powerful tool that data analysts rely on heavily. Mastering its most-used formulas can significantly enhance your efficiency and accuracy when working with data. In this blog post, we will explore the seven essential Excel formulas that every data analyst should know. We’ll break down each formula, explain its purpose, and provide examples to illustrate how to use them effectively.
Raw Data Overview
For our examples, we’ll be using a dataset from a car dealership. This dataset includes various attributes such as:
- Make (Car brand)
- Model
- MSRP (Manufacturer’s Suggested Retail Price)
- Invoice Price
- Used/New Price
- Body Size
- Body Style
- Horsepower
- Horsepower with RPM
- Torque
- Highway Fuel Economy
This dataset is similar to what you’ll encounter in real-world scenarios, containing both text and numerical data.
1. Aggregation Formulas
The first set of formulas we’ll discuss are the aggregation formulas: SUM, AVERAGE, COUNT, MIN, and MAX. These are foundational for quickly summarizing data.
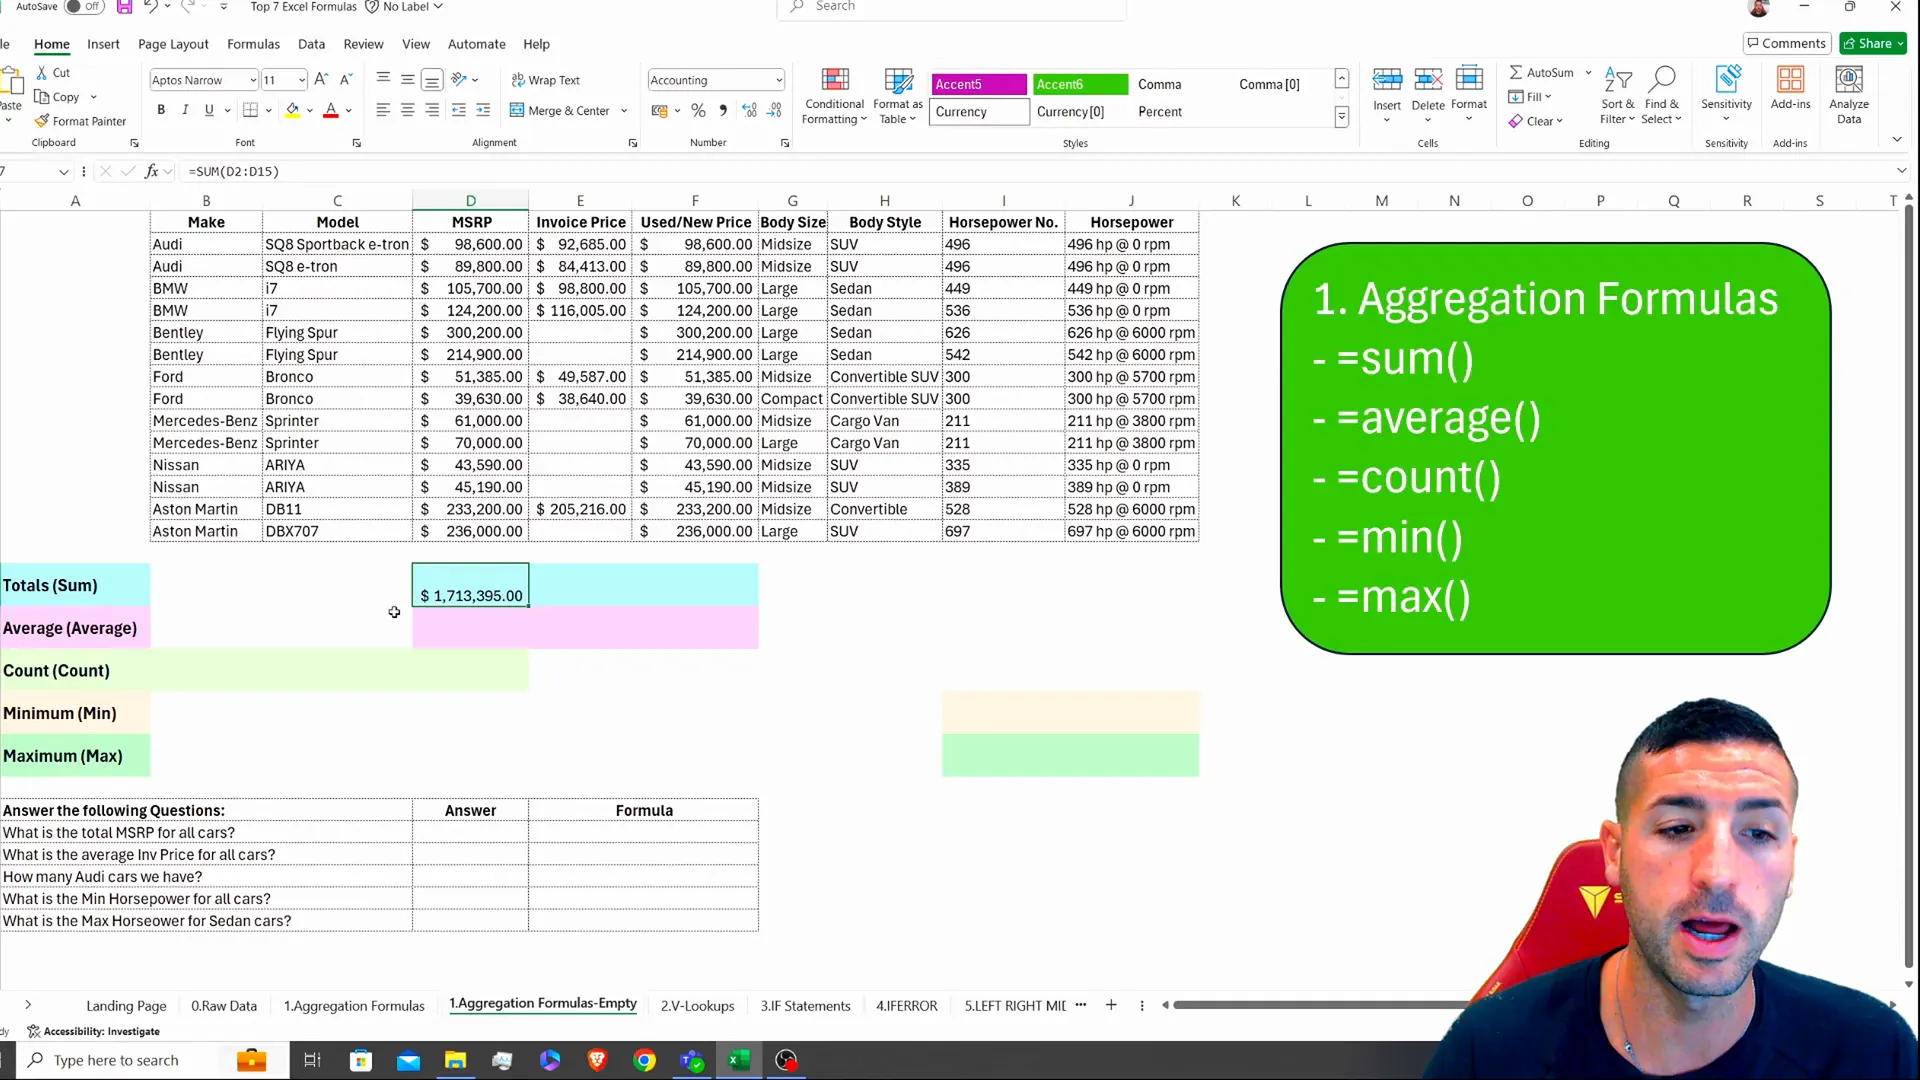
Using SUM
To calculate the total MSRP for all cars, you would use the following formula:
=SUM(range)For example, if you want to sum the MSRP column, it will give you the total retail price for all cars combined. Let’s say this total is 1.7 million.
Using AVERAGE
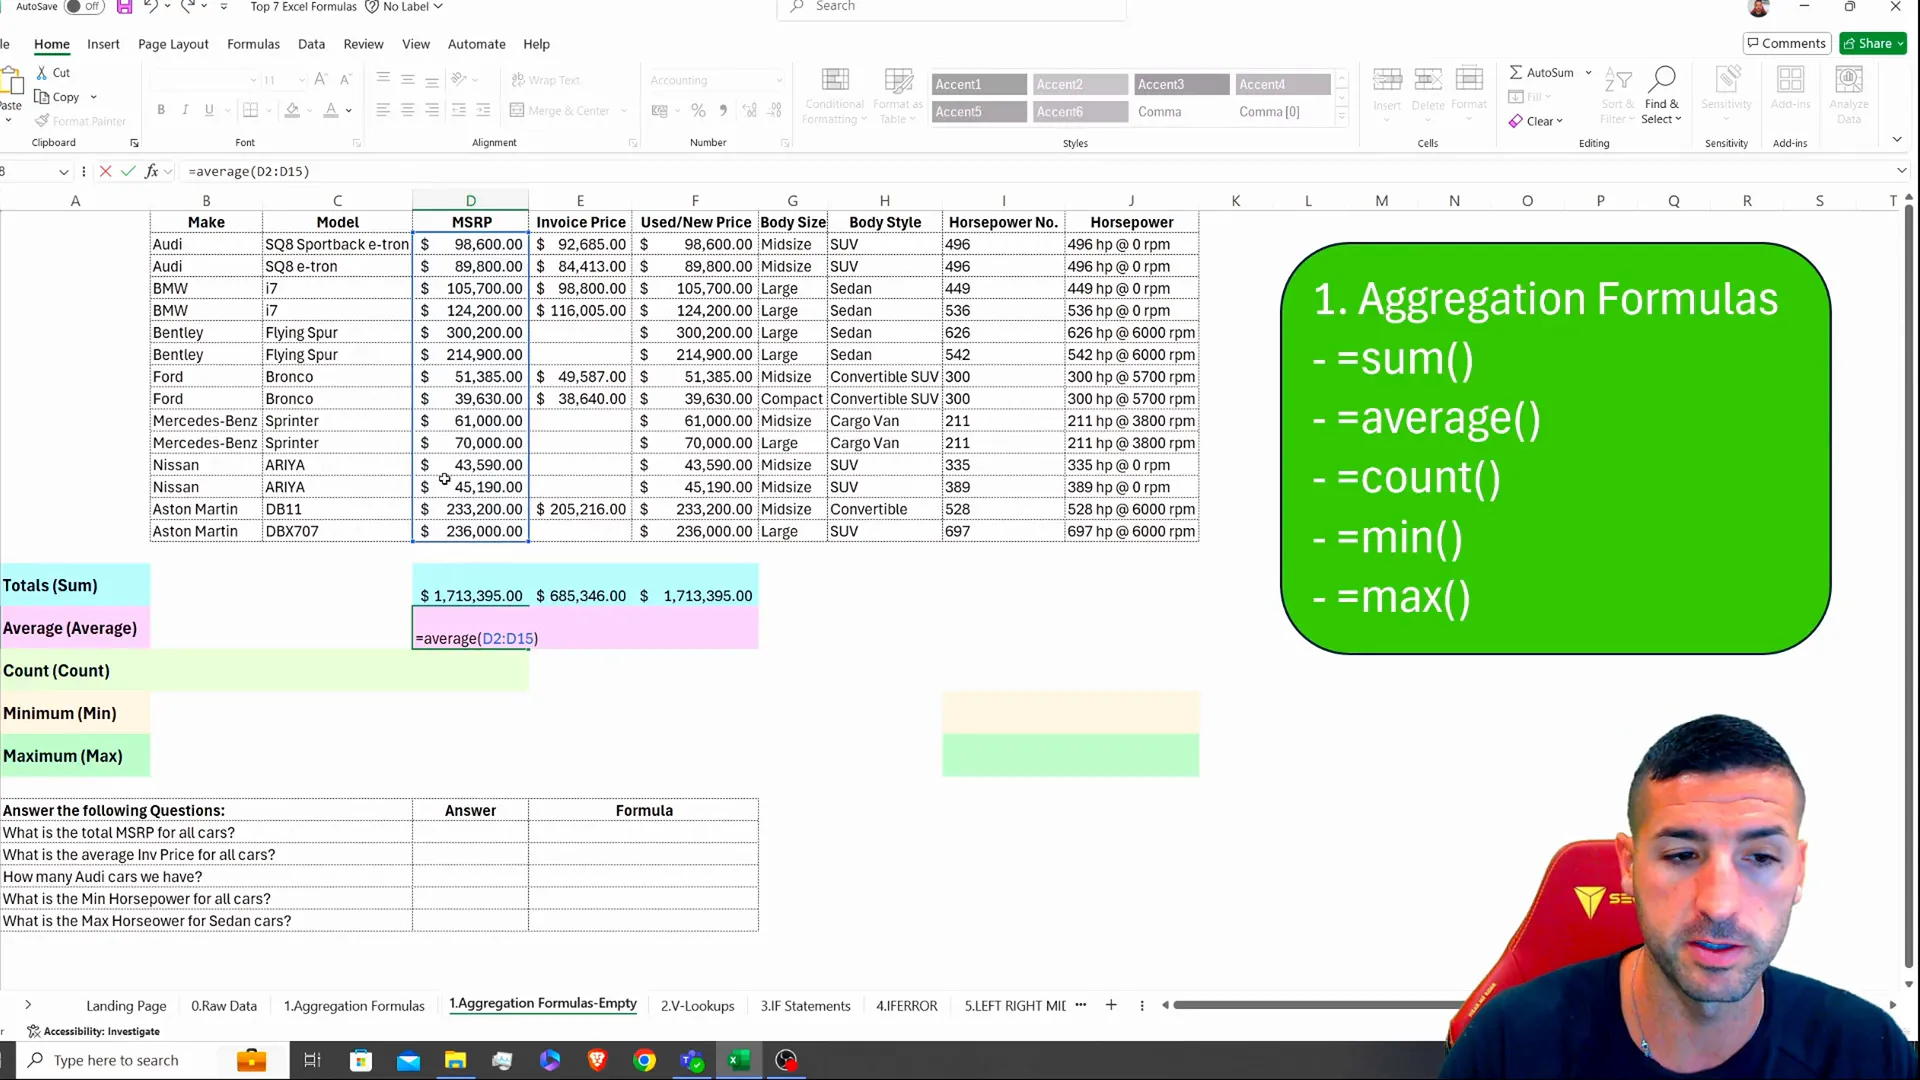
To find the average MSRP, use:
=AVERAGE(range)Selecting the entire MSRP range will yield the average price of the cars.
Using COUNT and COUNTA
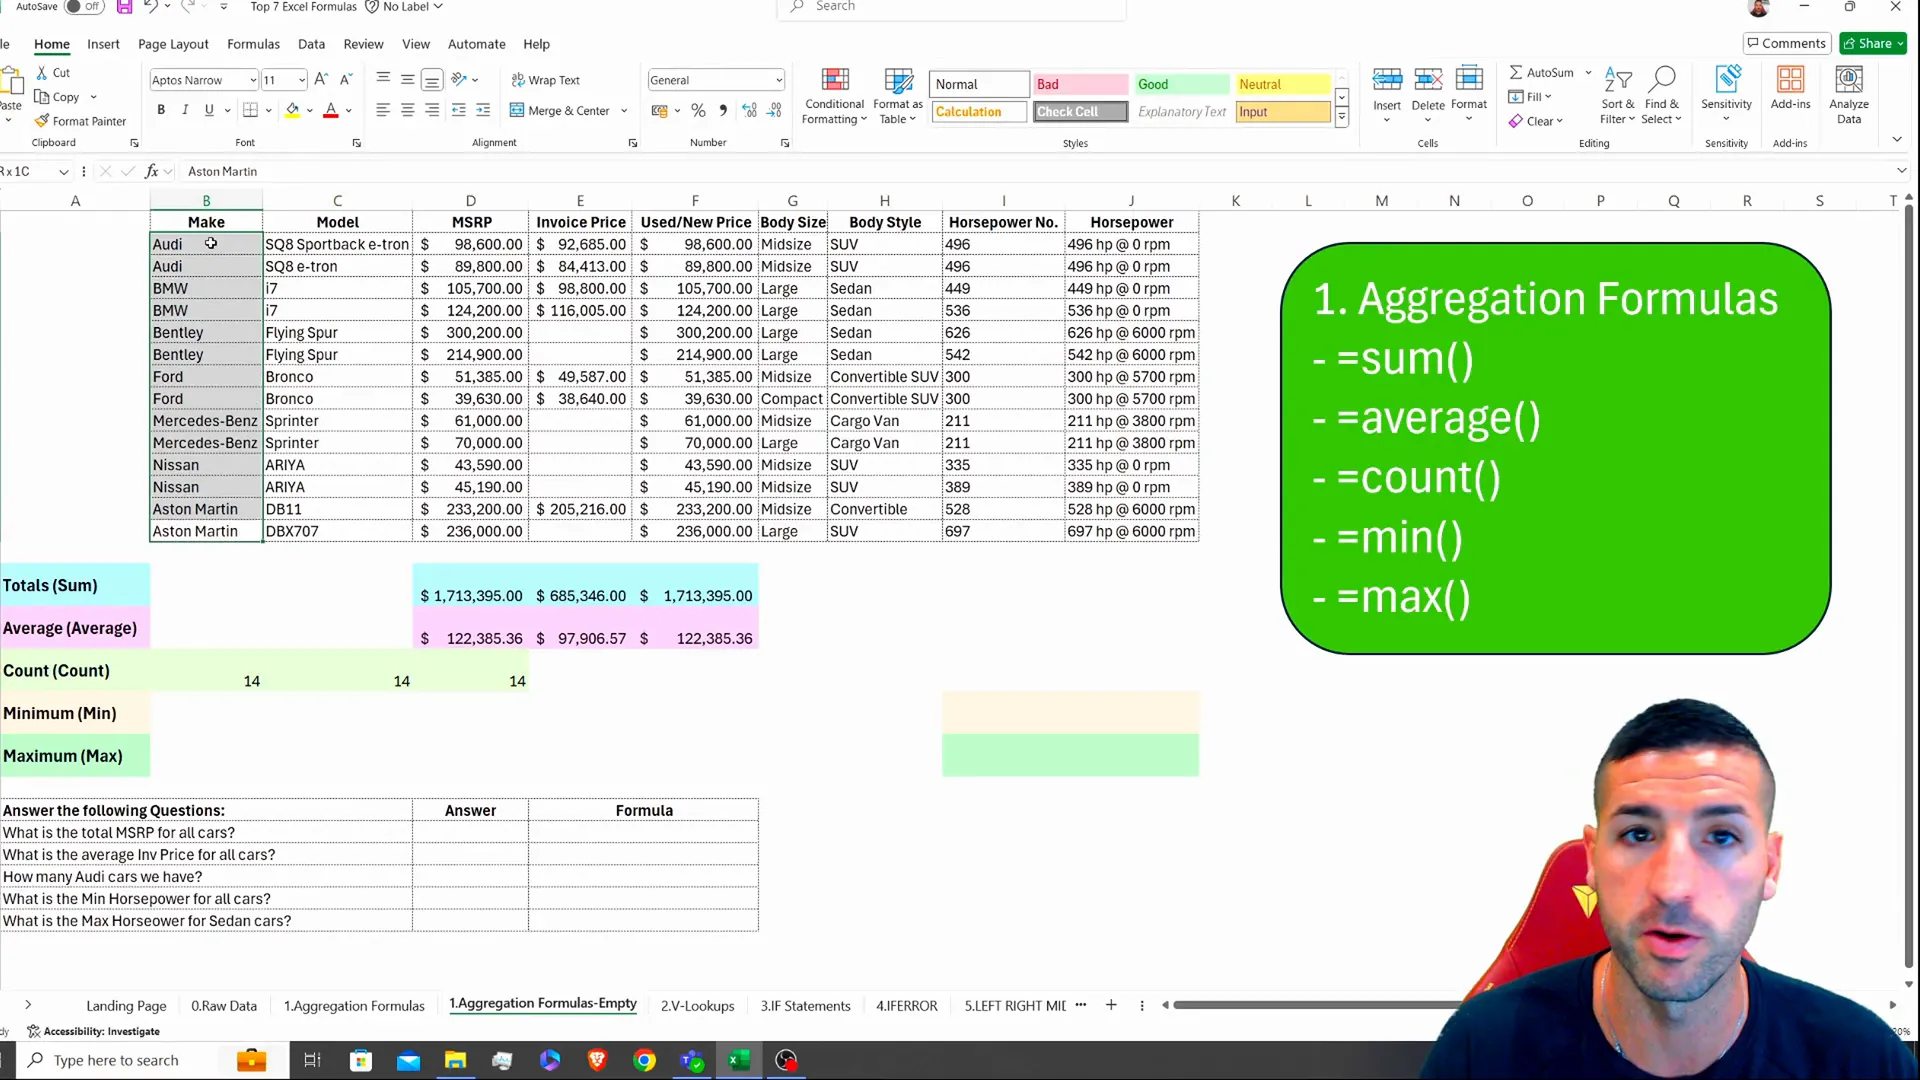
To count the number of car makes, use:
=COUNT(range)This counts only numerical entries. For text entries, use:
=COUNTA(range)This will count all entries, both text and numbers.
Using MIN and MAX
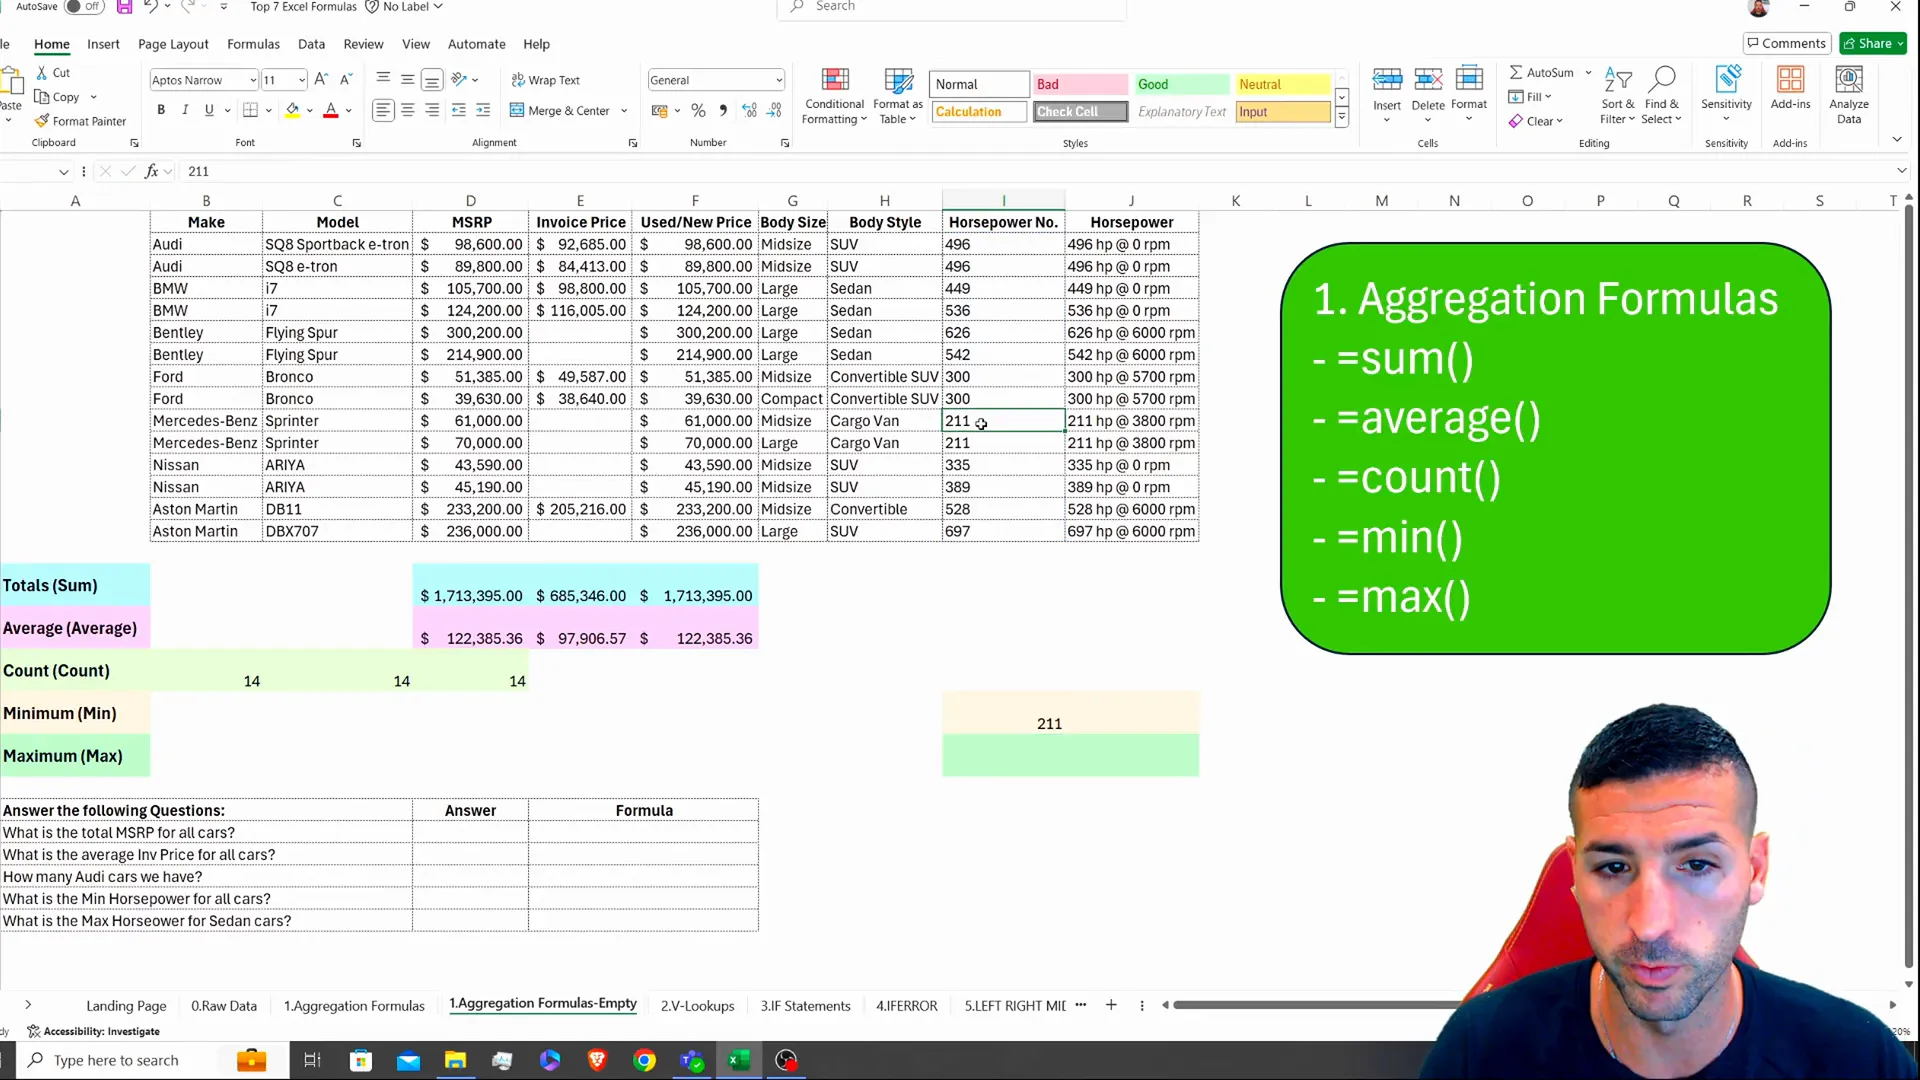
To find the minimum and maximum values, you would use:
=MIN(range)=MAX(range)This helps identify the lowest and highest values in the dataset.
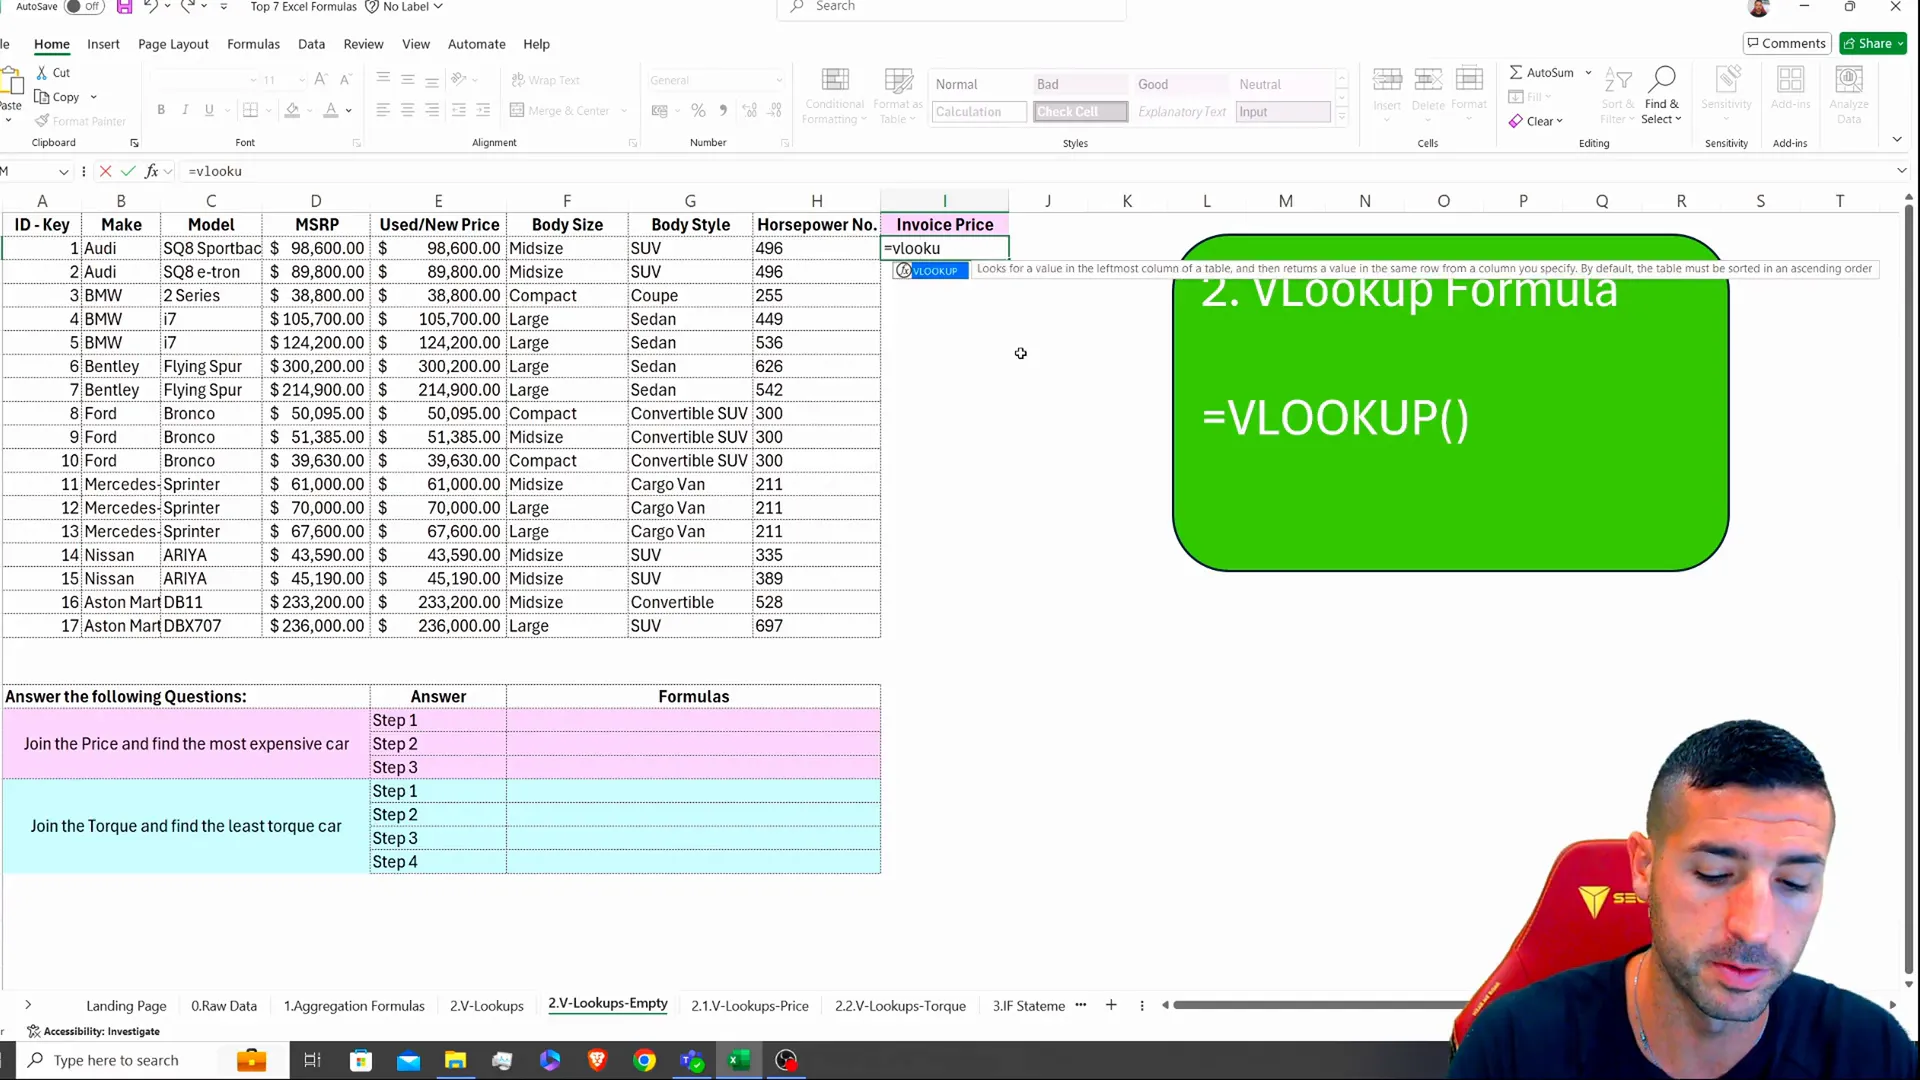
2. VLOOKUP
VLOOKUP is invaluable for combining data from different sheets or tables. For instance, if you want to find the invoice price based on a car’s ID, you would use:
=VLOOKUP(lookup_value, table_array, col_index_num, [range_lookup])In this case, the lookup value is the car ID, the table array is the range of data containing the invoice prices, and the column index number indicates which column to return.
3. IF Statements
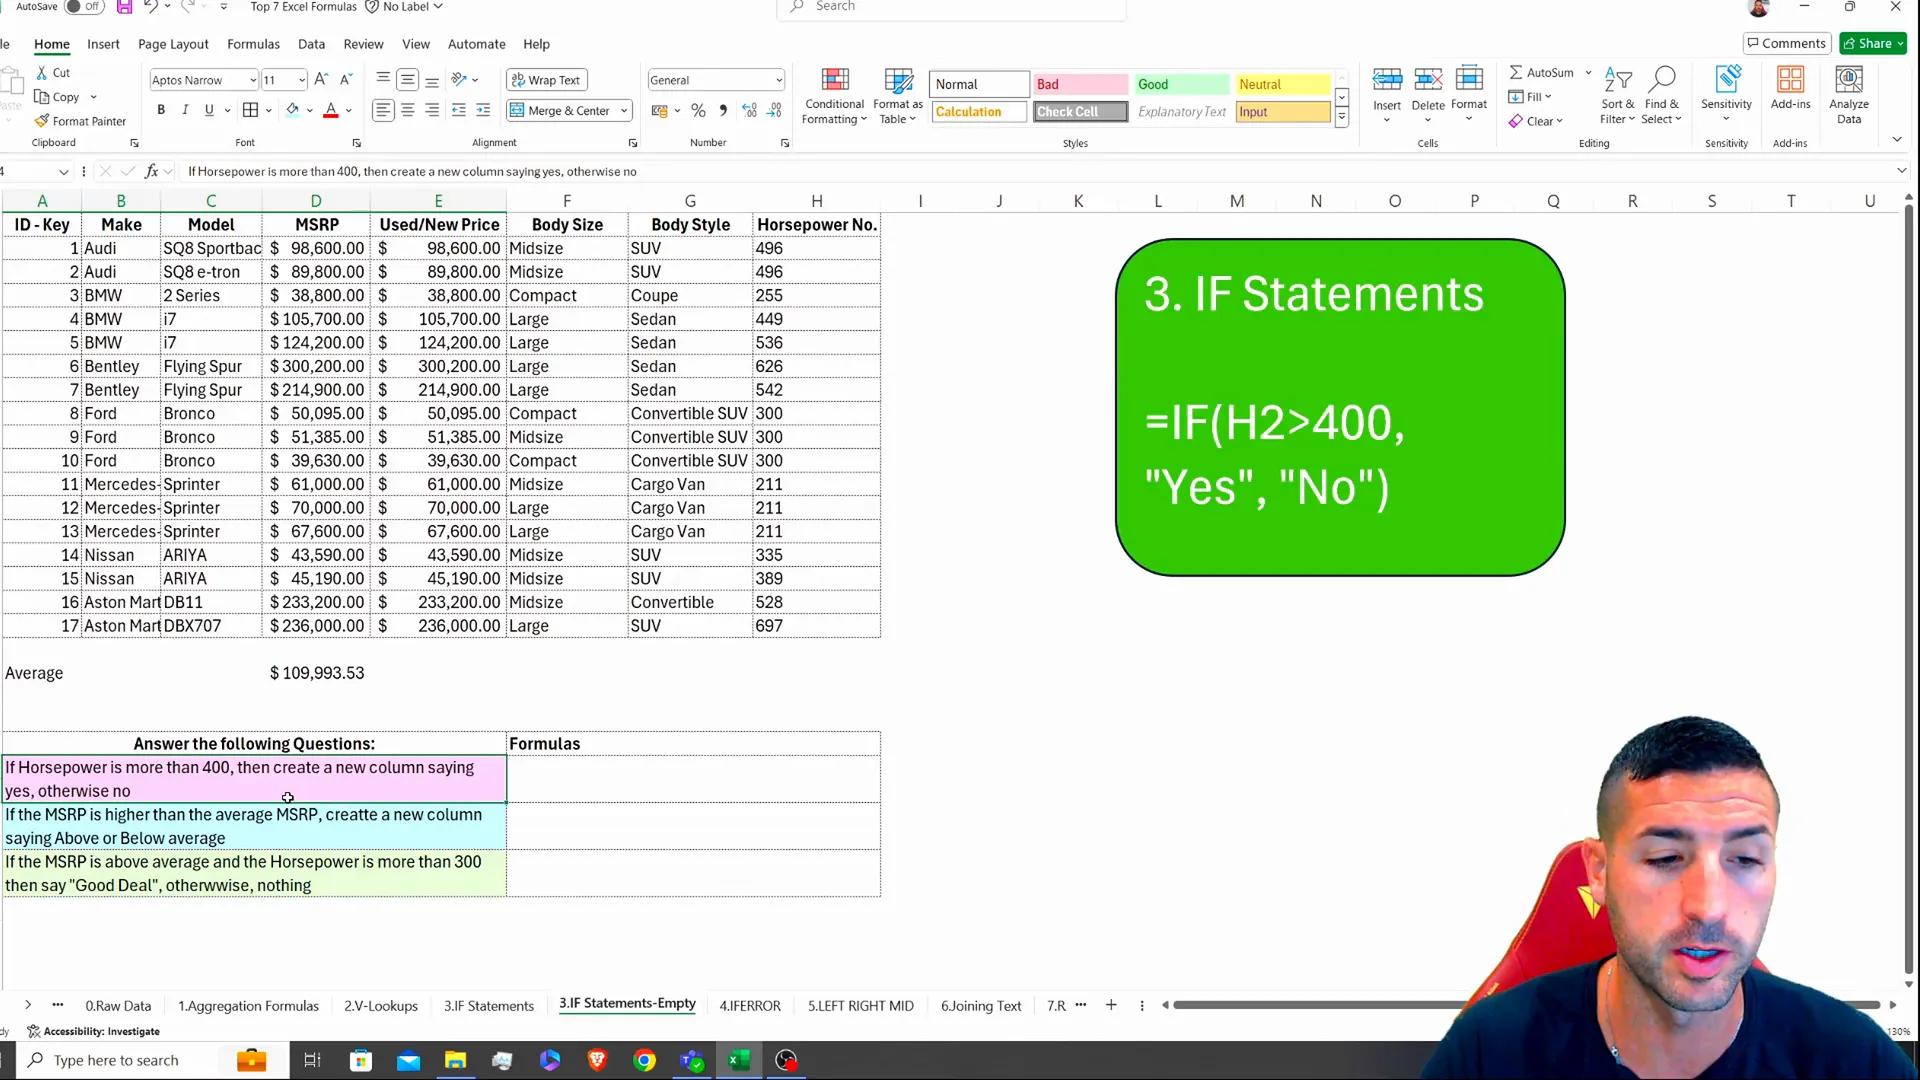
IF statements allow you to perform logical tests and return values based on the results. For example, if you want to check if the horsepower is greater than 400:
=IF(horsepower > 400, "Yes", "No")This will return “Yes” if the condition is true and “No” otherwise.
4. IFERROR
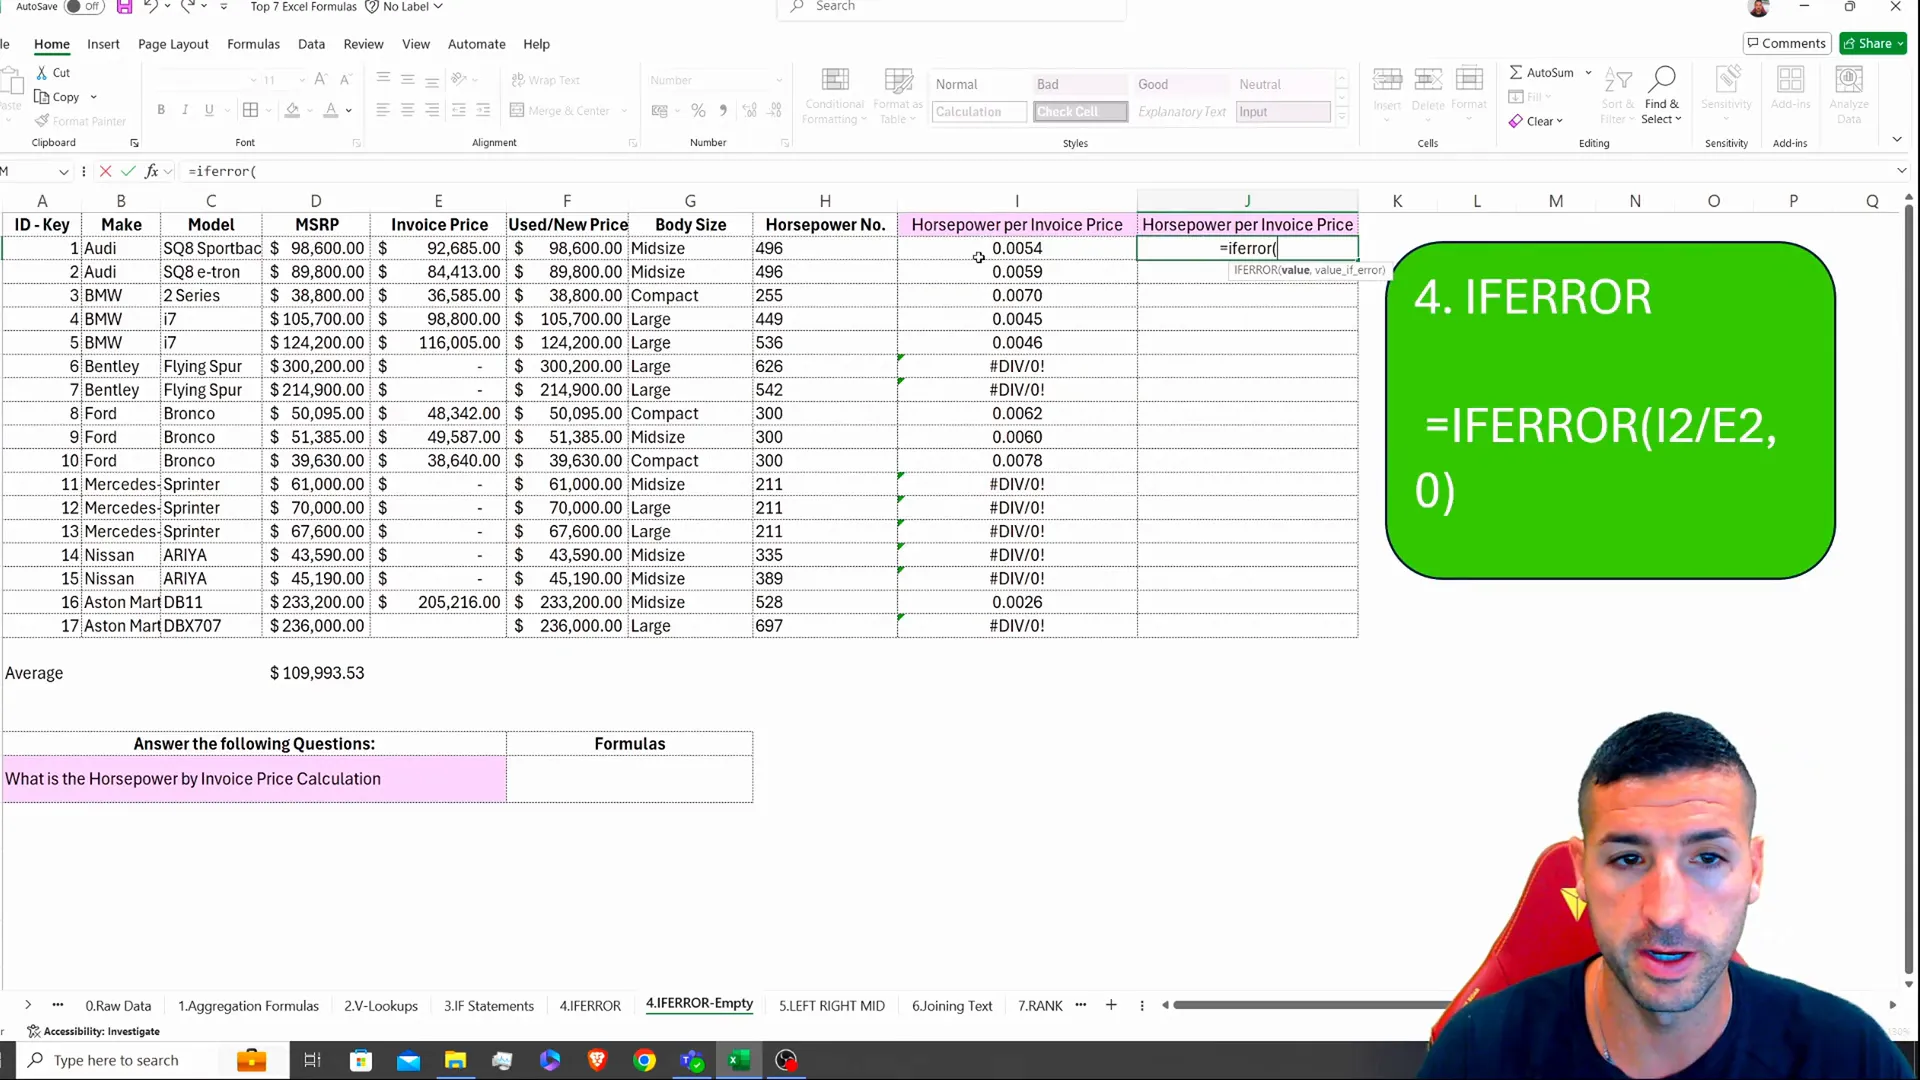
IFERROR is essential for handling errors gracefully. For instance, when dividing horsepower by invoice price, if there are any empty cells, it will return an error. To avoid this, you can wrap the calculation in an IFERROR function:
=IFERROR(horsepower/invoice_price, "Missing Data")This will return “Missing Data” instead of an error if the division cannot be performed.
5. Text Functions: LEFT, RIGHT, MID, and SUBSTITUTE
These functions are crucial for manipulating text strings. For example:
Using LEFT
If you want to extract the first three characters of a horsepower value:
=LEFT(cell, 3)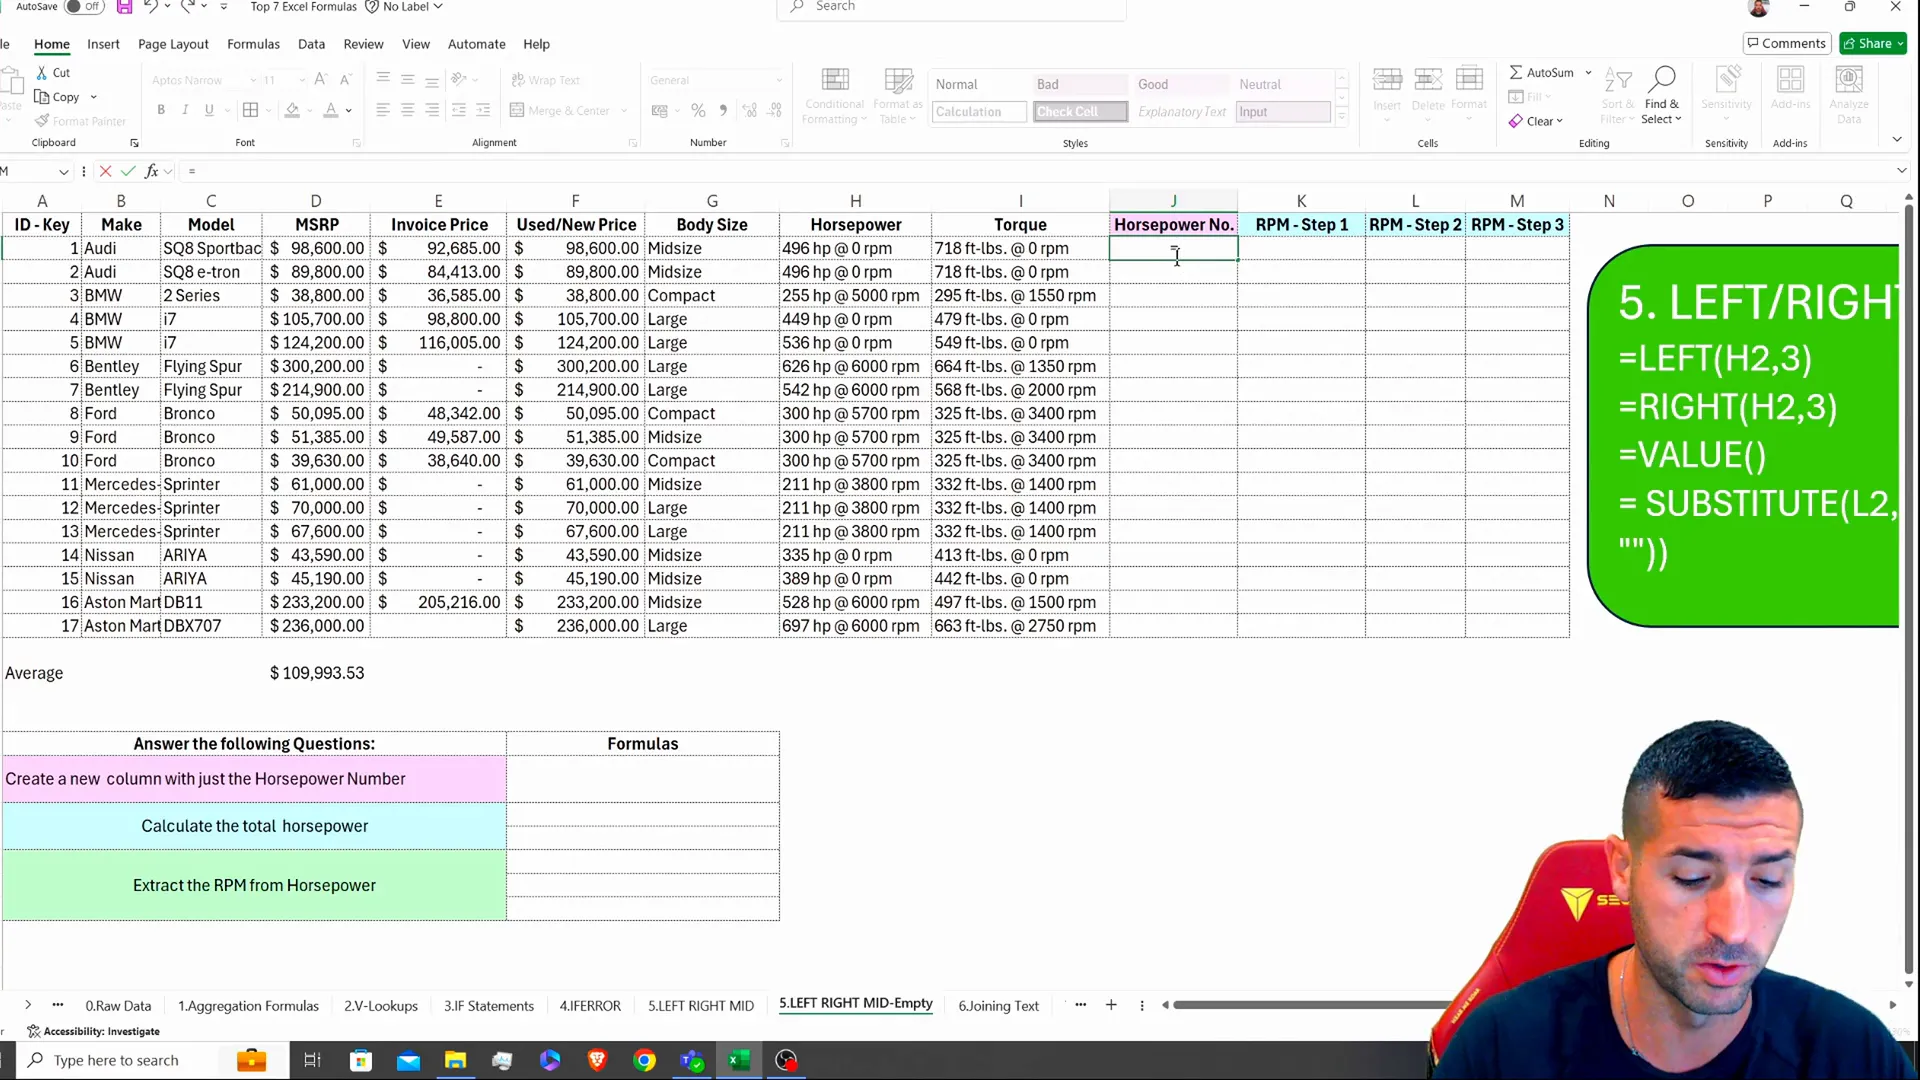
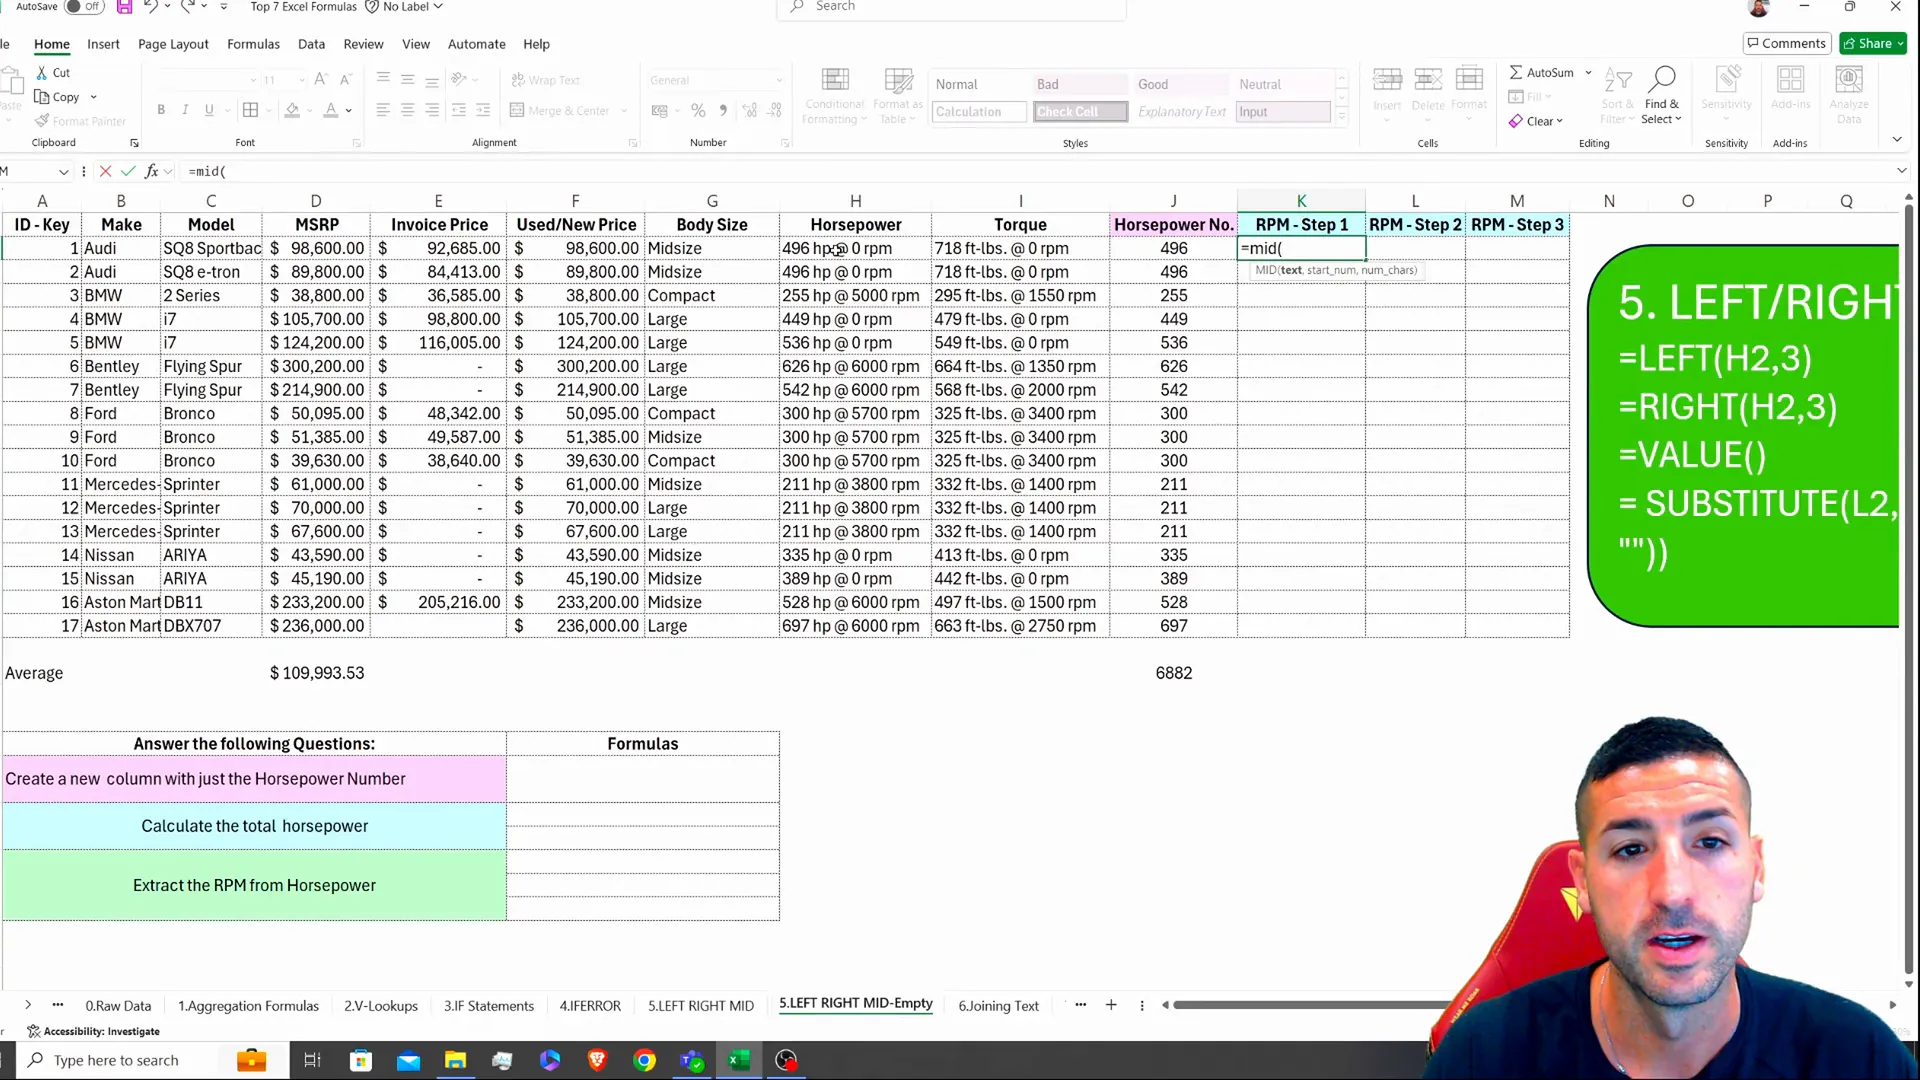
Using MID
To extract a substring from a string, you can use MID:
=MID(cell, start_num, num_chars)For example, to get the RPM from a string, you could specify the starting point and the number of characters.
Using SUBSTITUTE
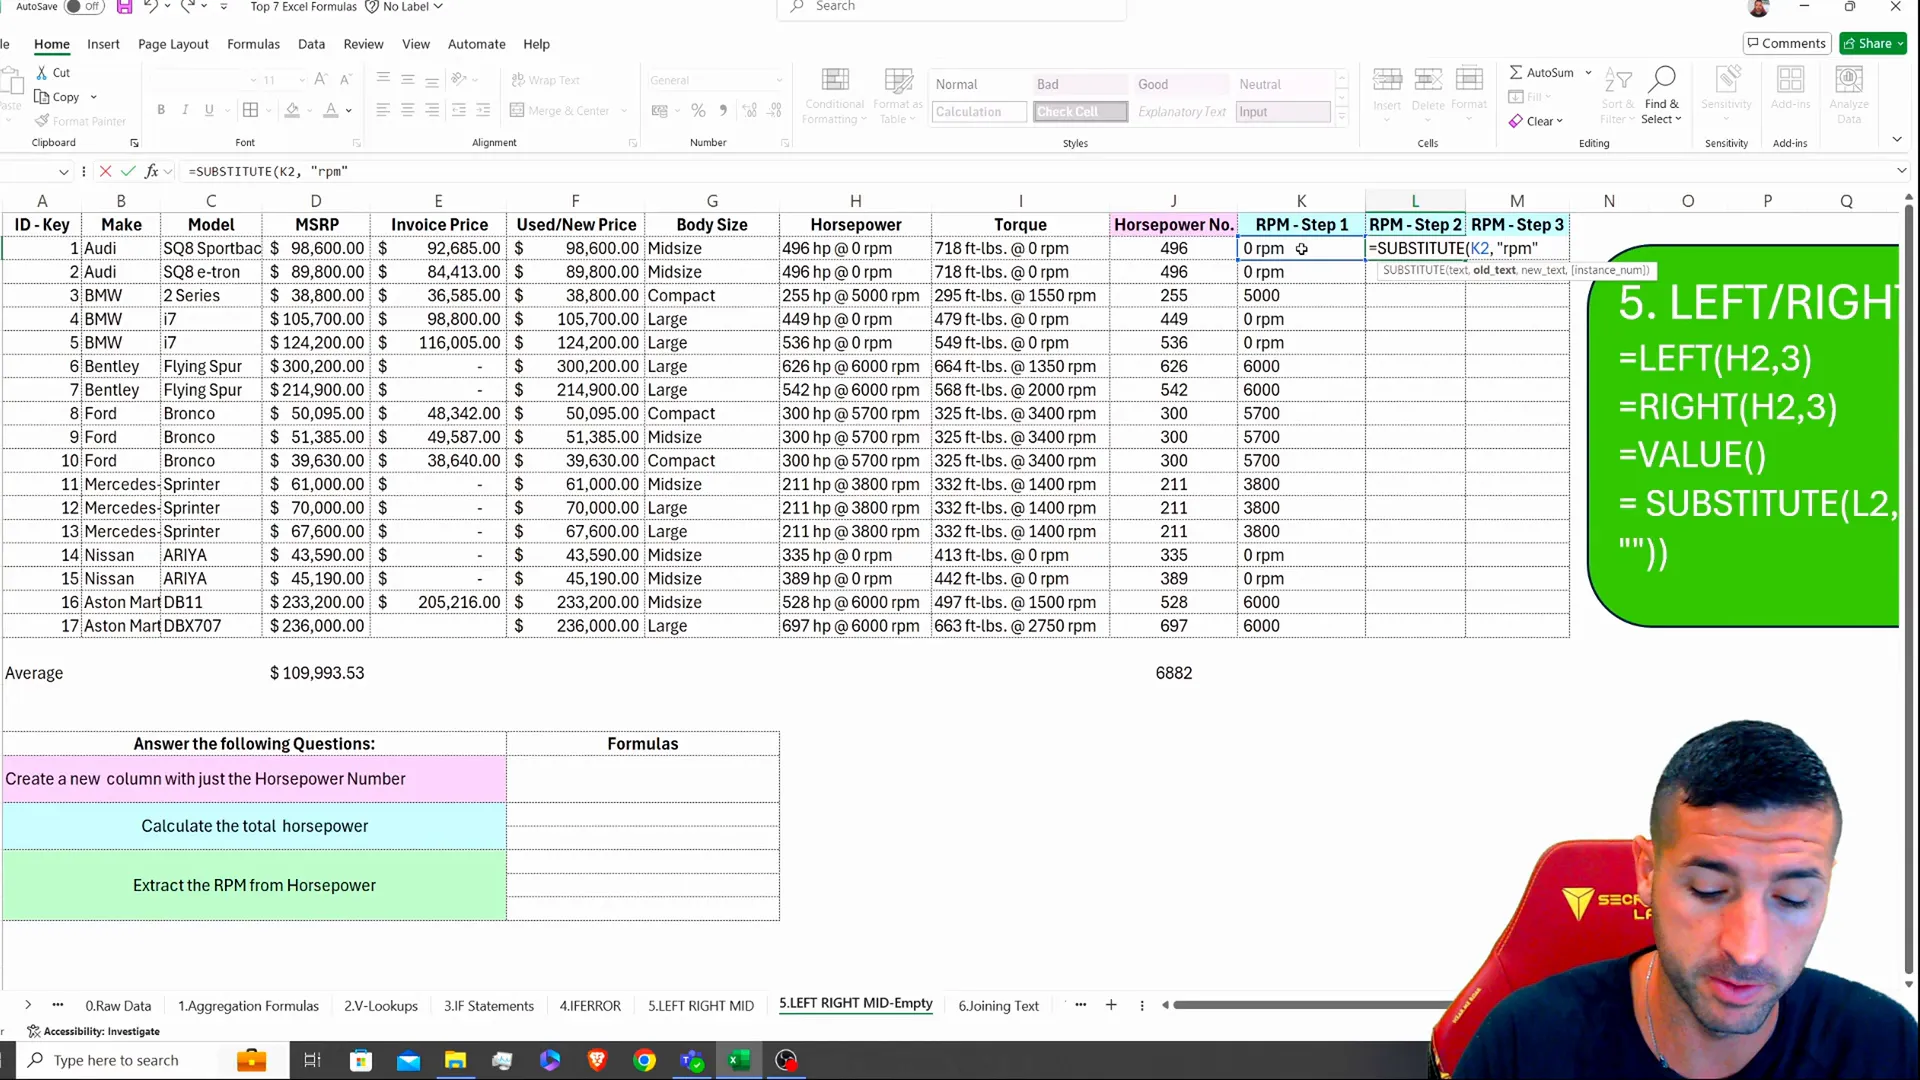
To replace specific text in a string, use SUBSTITUTE:
=SUBSTITUTE(cell, "RPM", "")This will remove “RPM” from the string entirely.
6. RANK
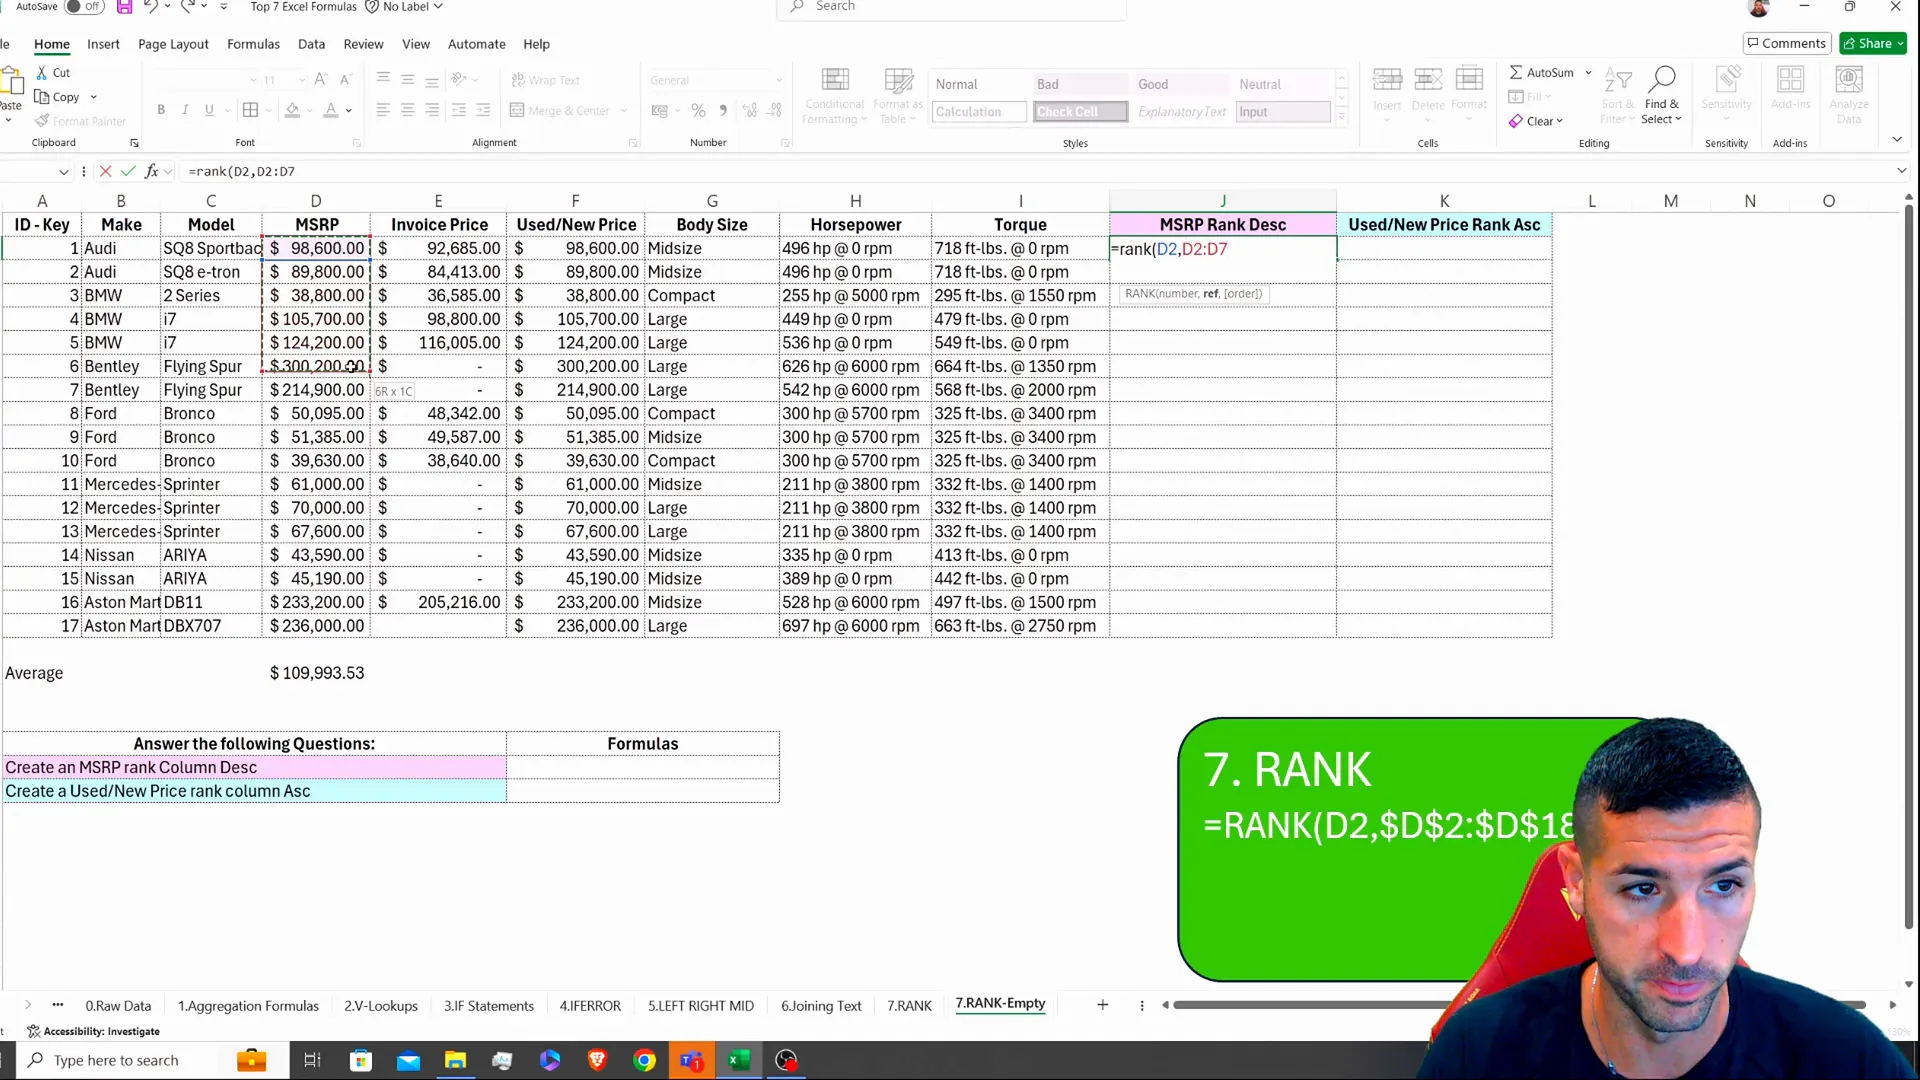
To rank values in a dataset, the RANK function is handy. For example, to rank the MSRP in descending order:
=RANK(value, range, [order])This will help you identify the most expensive cars based on their MSRP.
Conclusion
These seven formulas are fundamental tools for any data analyst working in Excel. They will save you time, reduce errors, and improve your ability to analyze data effectively. Whether you’re calculating totals, looking up values, or manipulating text, mastering these formulas will enhance your productivity and data analysis capabilities.
If you want to dive deeper into Excel tutorials and resources, check out this GitHub repository for more insights and examples.
Don’t forget to connect with me on X for more tips and updates on data analytics!
