If you’re preparing for an Excel test as part of a job interview, you’re in the right place! In this guide, we’ll walk through a practical example of an Excel test, dissecting it question by question. This way, you can understand the thought process behind each answer and be well-prepared for your own test.
Understanding the Dataset
As soon as you receive your test, the first step is to familiarize yourself with the dataset. In our example, we have data from a car dealership that includes the Manufacturer’s Suggested Retail Price (MSRP), price, body size, body style, horsepower, and highway fuel economy. It’s essential to understand what each column represents, even if you can’t ask questions during the test.
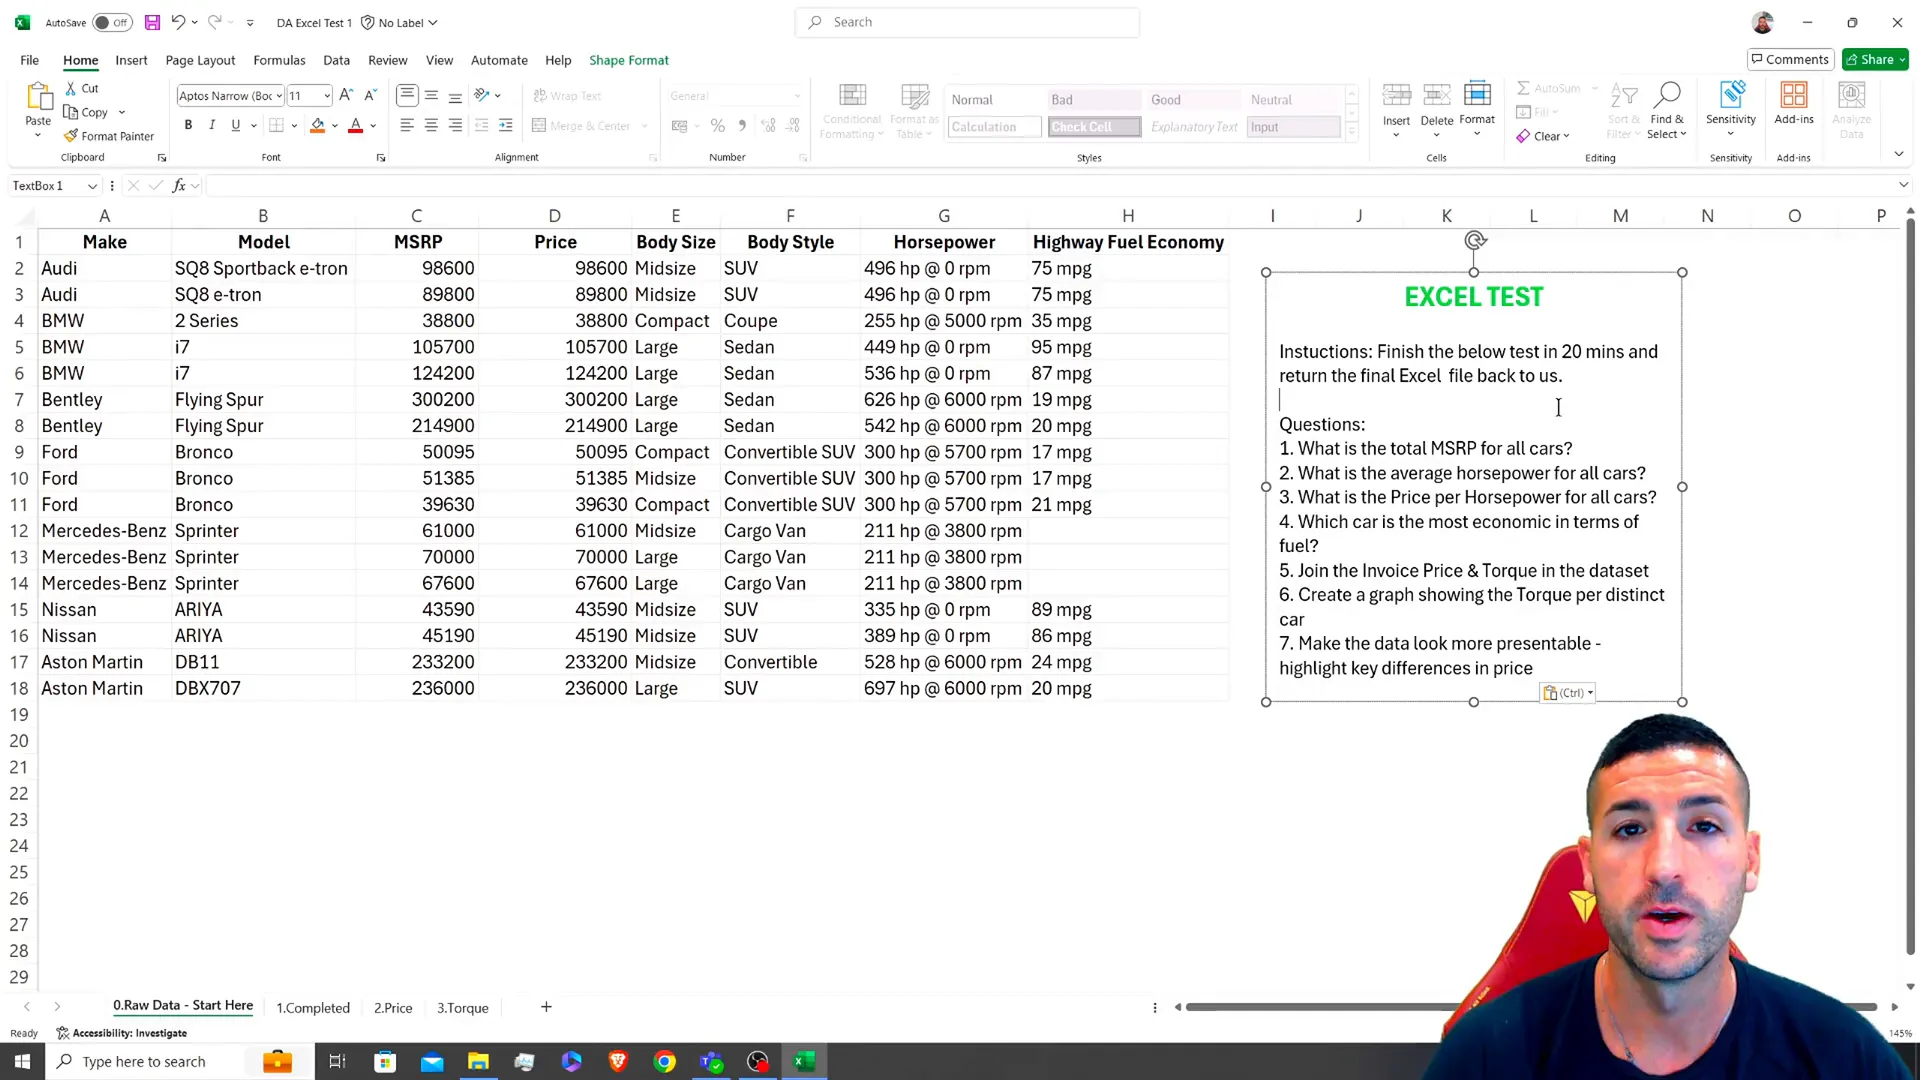
Question 1: What is the total MSRP for all cars?
This question requires you to aggregate the data by summing the MSRP column. The formula to use here is straightforward:
=SUM(range)Once you find the total, it’s good practice to format the result to make it visually appealing. Depending on your location, you might want to set the currency format to dollars, with zero decimal places.
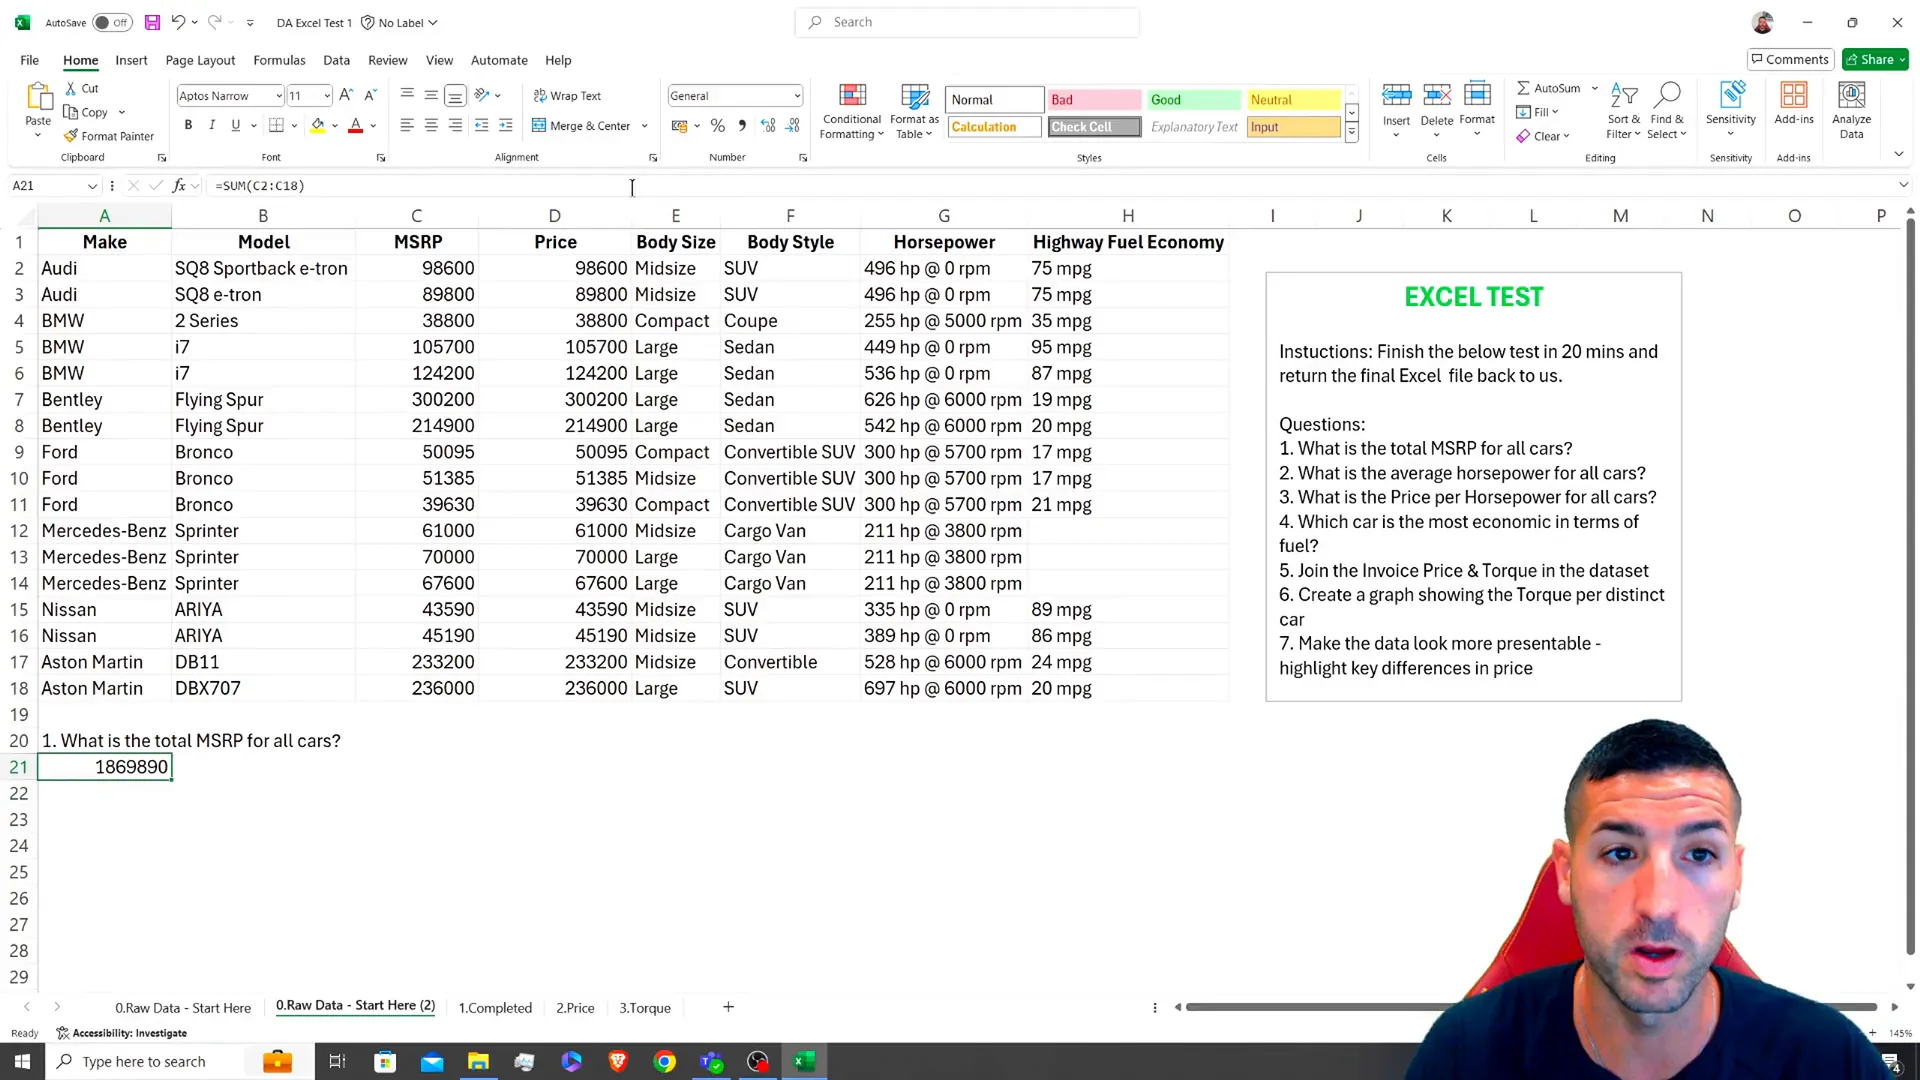
Question 2: What is the average horsepower for all cars?
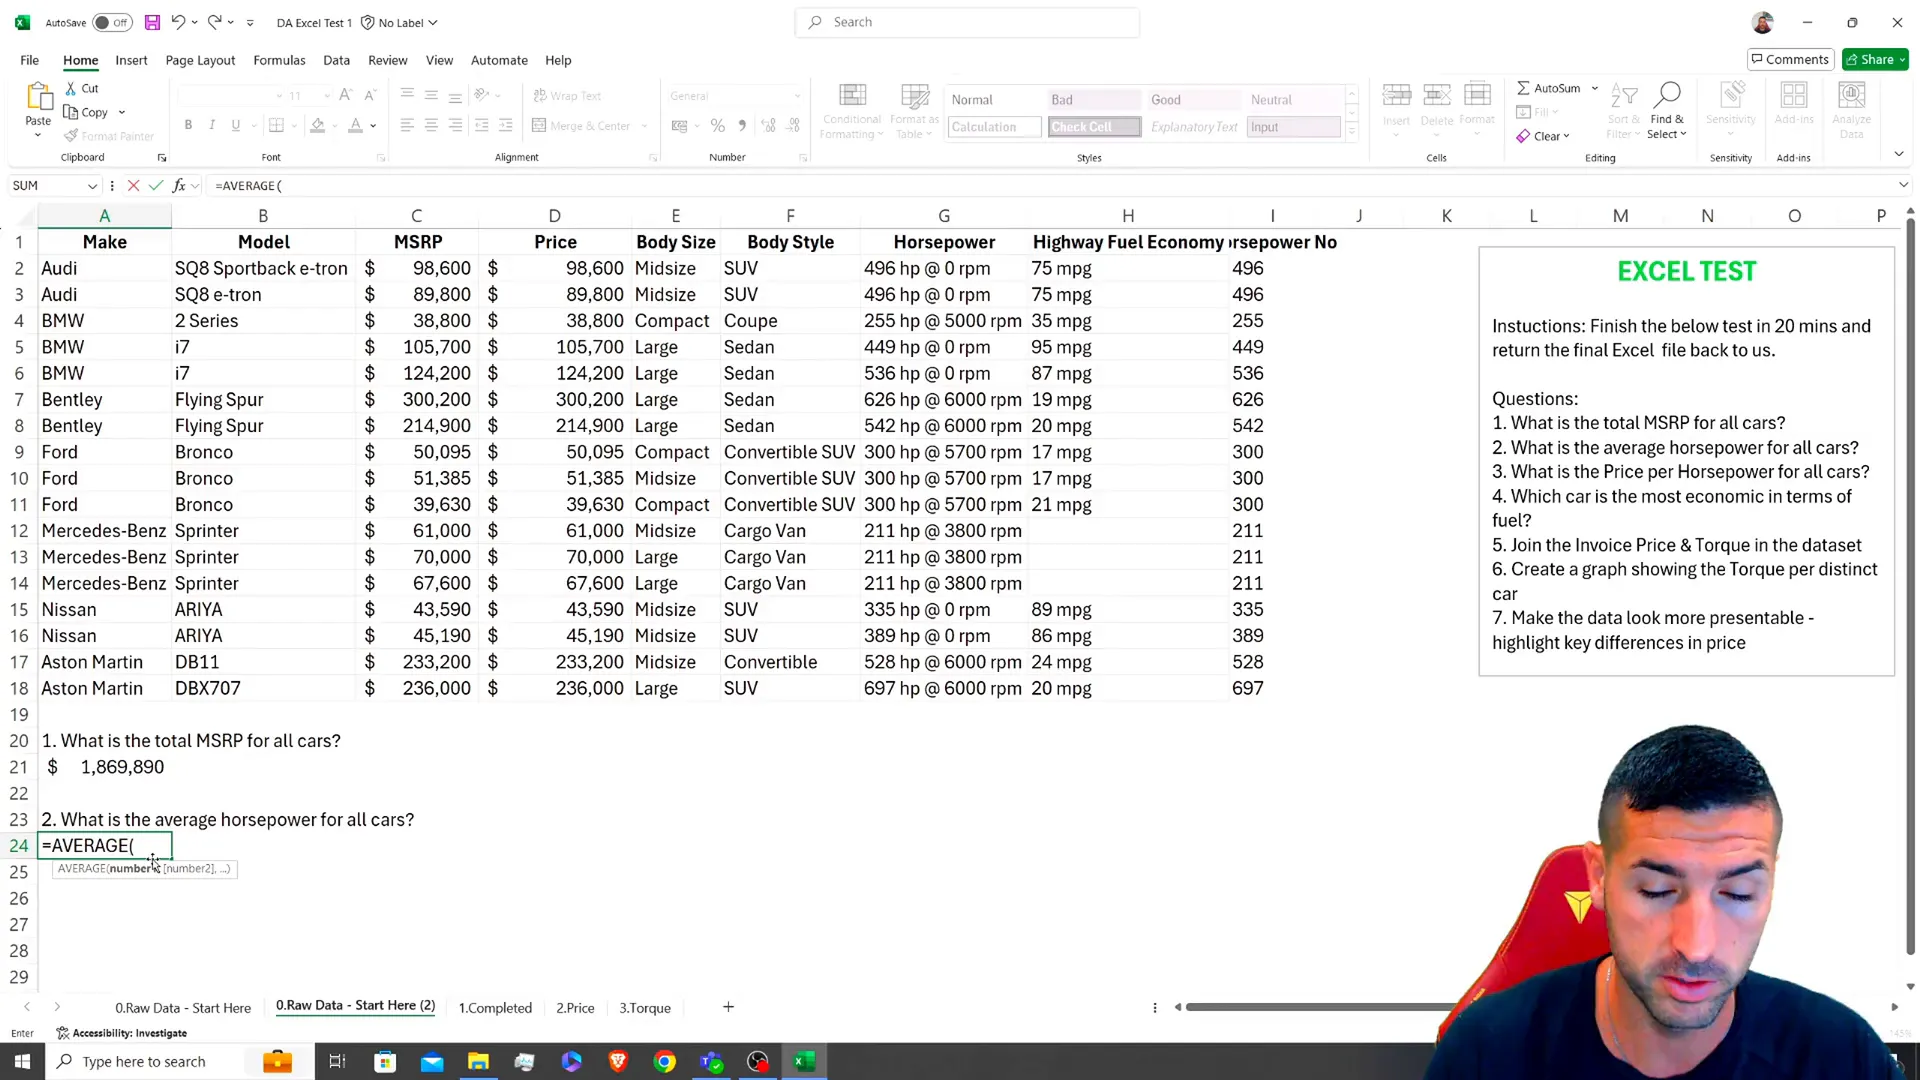
For this question, you’ll need to calculate the average of the horsepower column. However, the horsepower data may contain text, so you’ll first have to extract the numeric value. Create a new column to isolate the horsepower numbers using the LEFT function:
=LEFT(cell, 3)After extracting the numbers, convert them into values so that you can use the AVERAGE function:
=AVERAGE(range)Remember to format your cells appropriately as you go along!
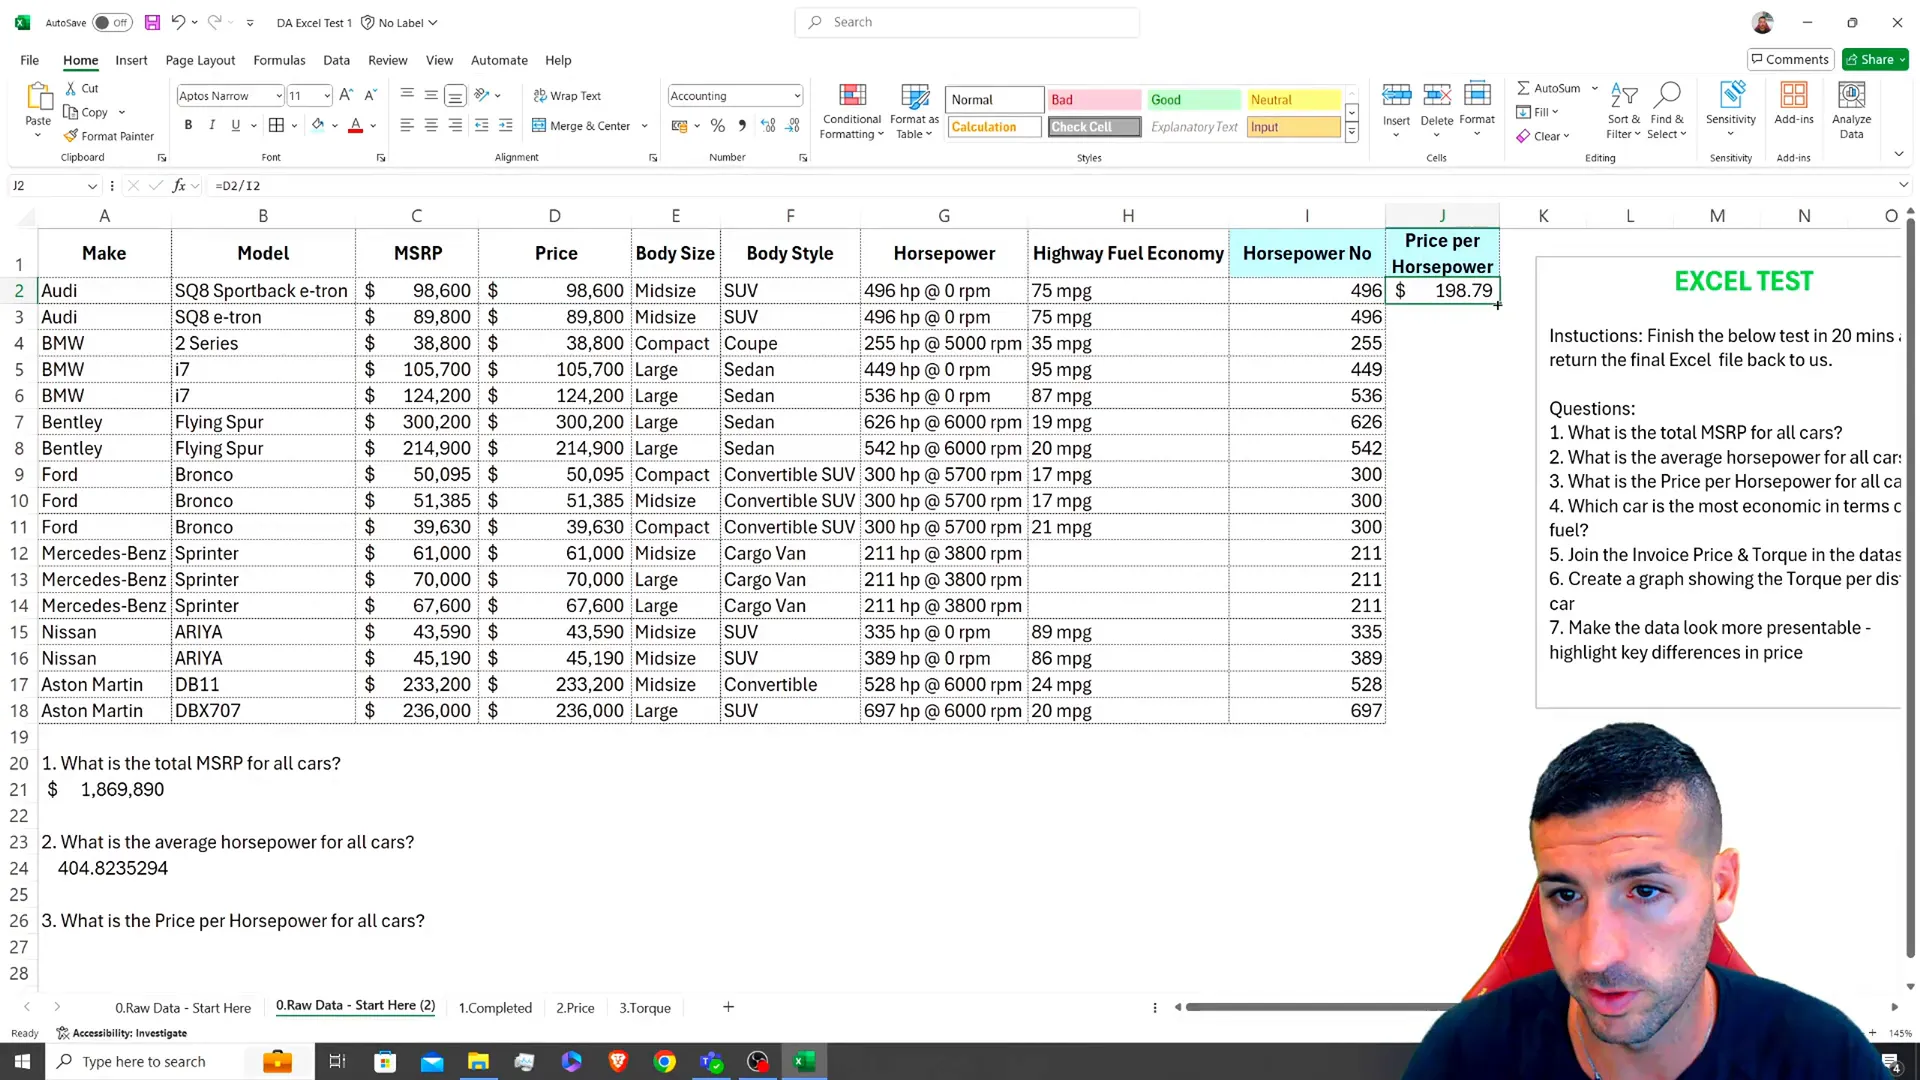
Question 3: What is the price per horsepower for all cars?
To answer this question, you need to create a new column titled “Price per Horsepower.” This is done by dividing the car price by the horsepower number you just calculated:
=Price/HorsepowerOnce you compute this, you’ll have the price per horsepower for each car, which fulfills the requirement of this question.
Question 4: Which car is the most economical in terms of fuel?
For this question, you need to find the car with the highest fuel economy. First, separate the numeric value from the text in the highway fuel economy column. Create another new column for the cleaned fuel economy numbers:
=LEFT(cell, 2)After cleaning the data, use the MIN function to find the minimum value, which indicates the most economical car:
=MIN(range)If there are any errors due to missing data, wrap your formula in an IFERROR function to handle those gracefully.

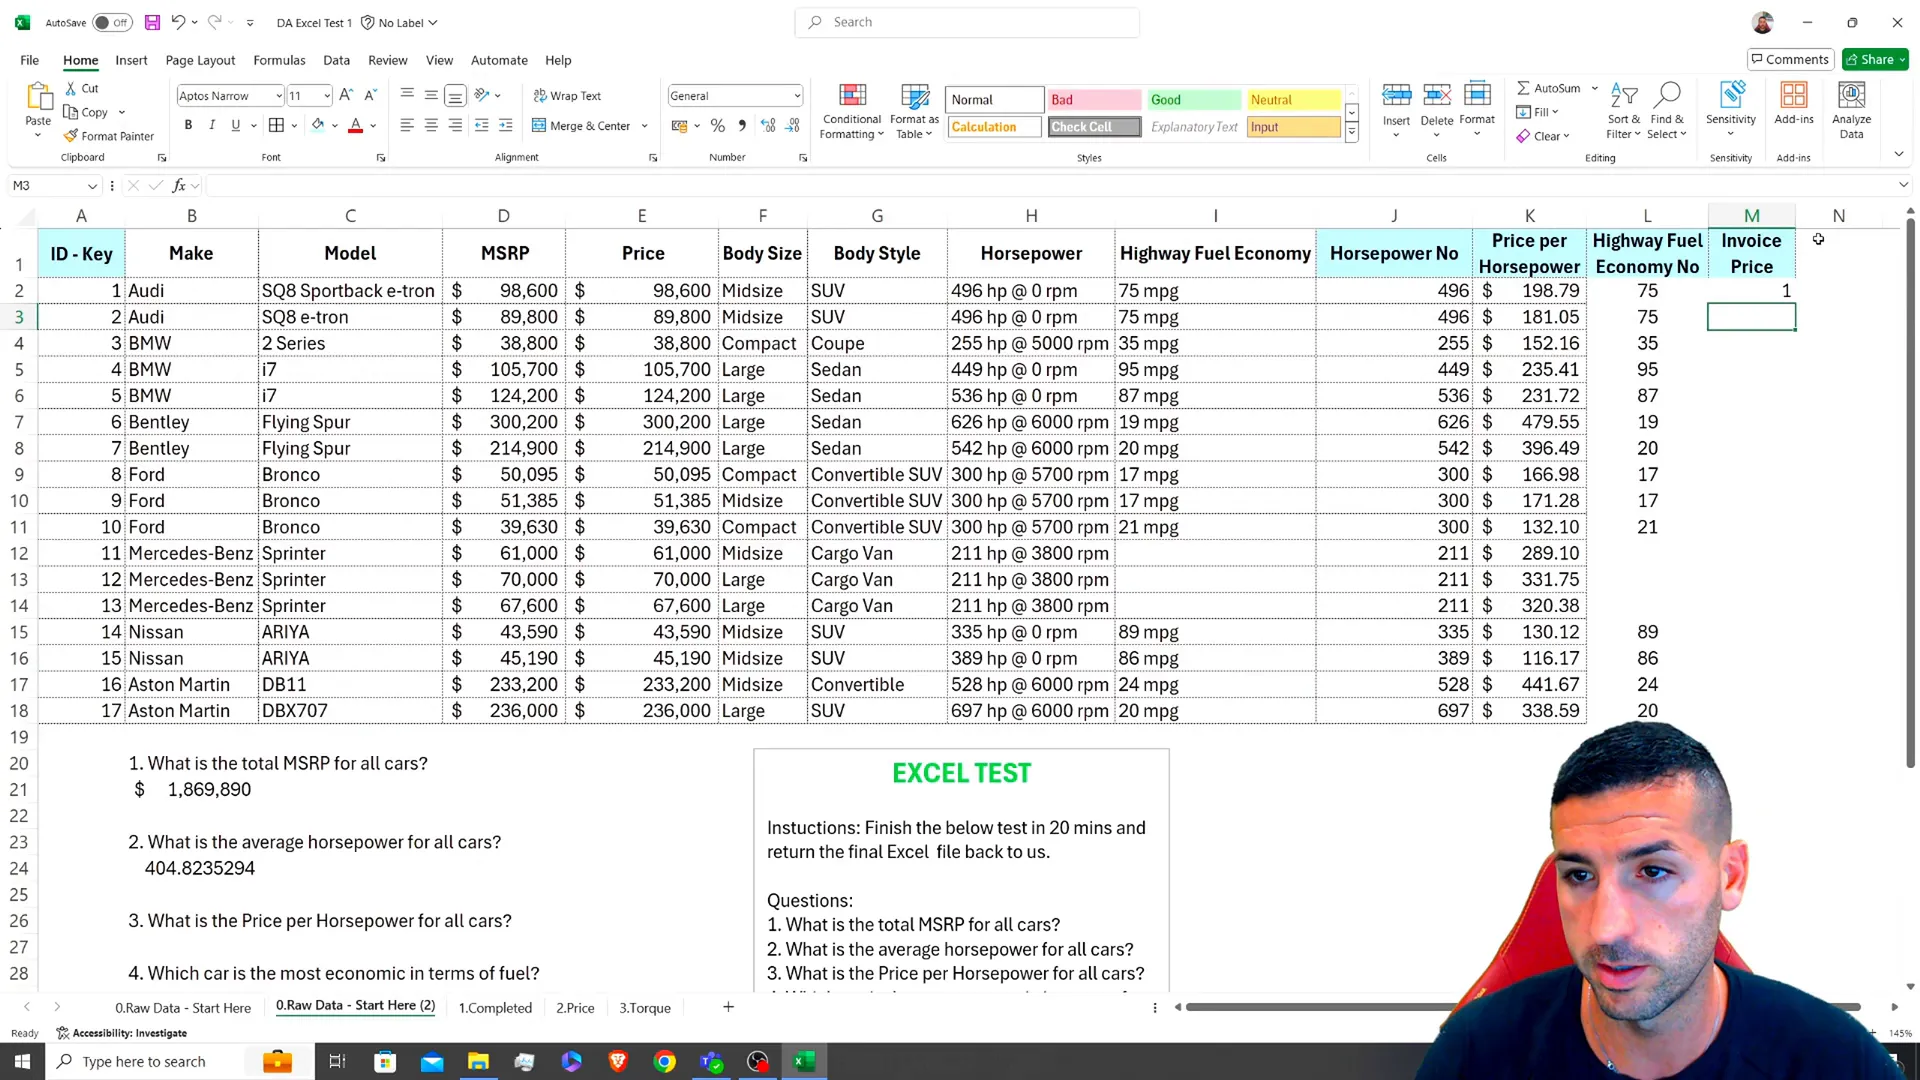
Question 5: Join the invoice price and torque in the dataset.
This question asks you to perform a join operation. You’ll need to identify the key columns (ID key) for both the torque and invoice price datasets. You can use the VLOOKUP function to achieve this:
=VLOOKUP(key, range, column_index, FALSE)Make sure to format the results correctly to enhance readability.
Question 6: Create a graph showing the torque per distinct car.
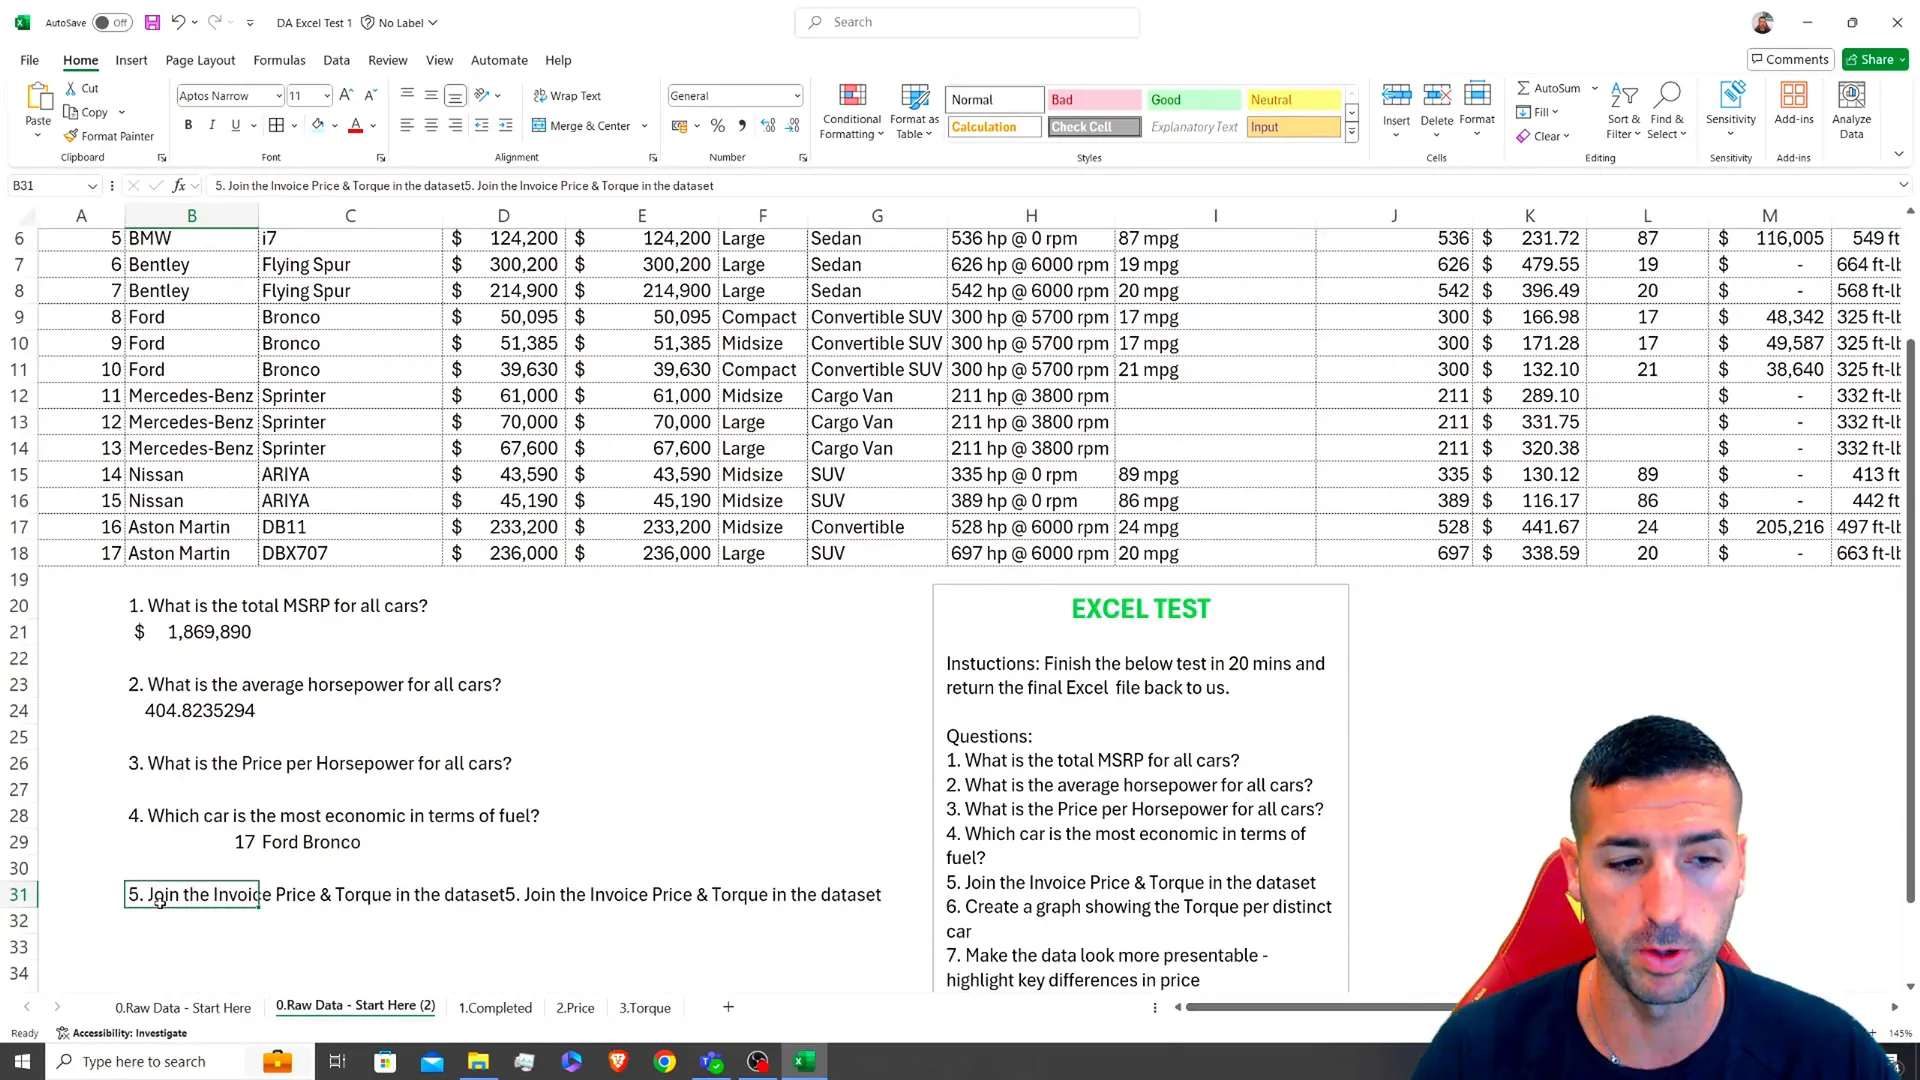
To visualize torque per distinct car, first create a distinct identifier by concatenating the ID, make, and model columns:
=CONCATENATE(ID, "-", Make, "-", Model)Next, clean the torque data as before, and then use Excel’s charting features to create a visual representation of your findings. Select the relevant data and insert a chart from the recommended options.
Question 7: Make the data look more presentable and highlight key differences in price.
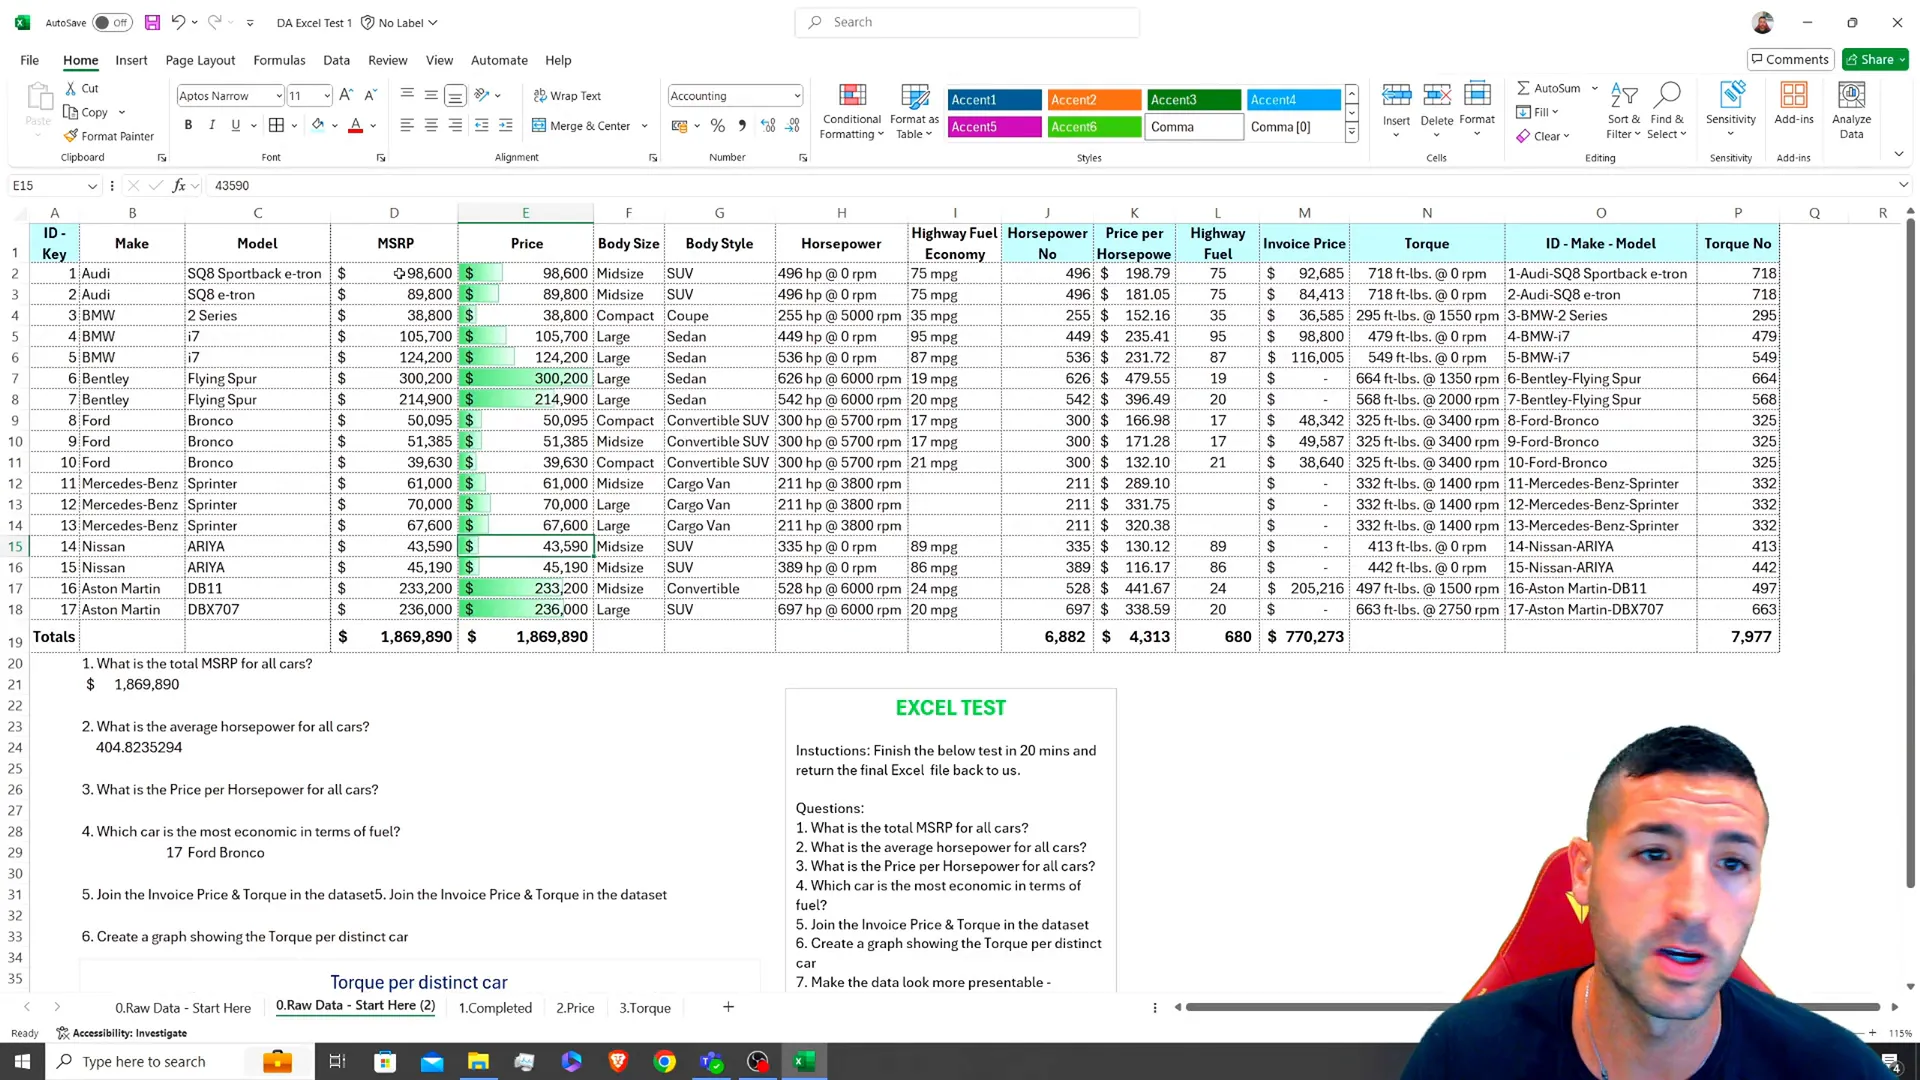
To wrap up the test, focus on formatting and presenting your data clearly. Here are some tips:
- Make columns narrower to fit everything on one screen.
- Add totals for key columns like MSRP and horsepower.
- Apply conditional formatting to highlight high and low prices.
- Consider adding filters to allow for easier data navigation.
These small touches can greatly enhance the readability and professionalism of your Excel worksheet.
Conclusion
Completing this Excel test in under 20 minutes is achievable with practice. This example not only tests your Excel skills but also your ability to think critically and work efficiently under pressure. Remember, the key to success is to practice these techniques and familiarize yourself with Excel’s functionalities before your test.
Let me know in the comments how long it took you to finish your test and whether you found it easy, average, or difficult. Stay tuned for more advanced tests that will include pivot tables and more complex functions!
For those looking to further enhance their skills, you can download the test example and practice using the files available on GitHub.
