
Welcome to an exciting journey into the world of data analysis using Large Language Models (LLMs) and SQL databases! This guide will walk you through the entire process of building a Streamlit app that utilizes the GROQ API to efficiently analyze relational data stored in SQL tables. With a focus on user-friendly interaction, we’ll enable natural language queries on SQL data, making it accessible and intuitive for everyone.
What You’ll Learn
In this tutorial, we will cover:
- Setting up the necessary libraries for SQL and LLM integration.
- Creating a basic Streamlit app that connects to a SQL database.
- Enhancing the app to allow users to filter data by specific brands.
- Implementing functionality to limit the data size to comply with LLM token limits.
- Deploying multiple versions of the app with improved features.
Getting Started: Libraries and Setup
To kick things off, let’s identify the libraries we need for this project:
- pyodbc: This library allows us to connect Python with SQL Server.
- groq: Used to call our LLM models.
- Streamlit: The framework we’ll use to build our app.
First, we need to load our data by establishing a connection to our SQL server. Make sure to have the correct server details ready.
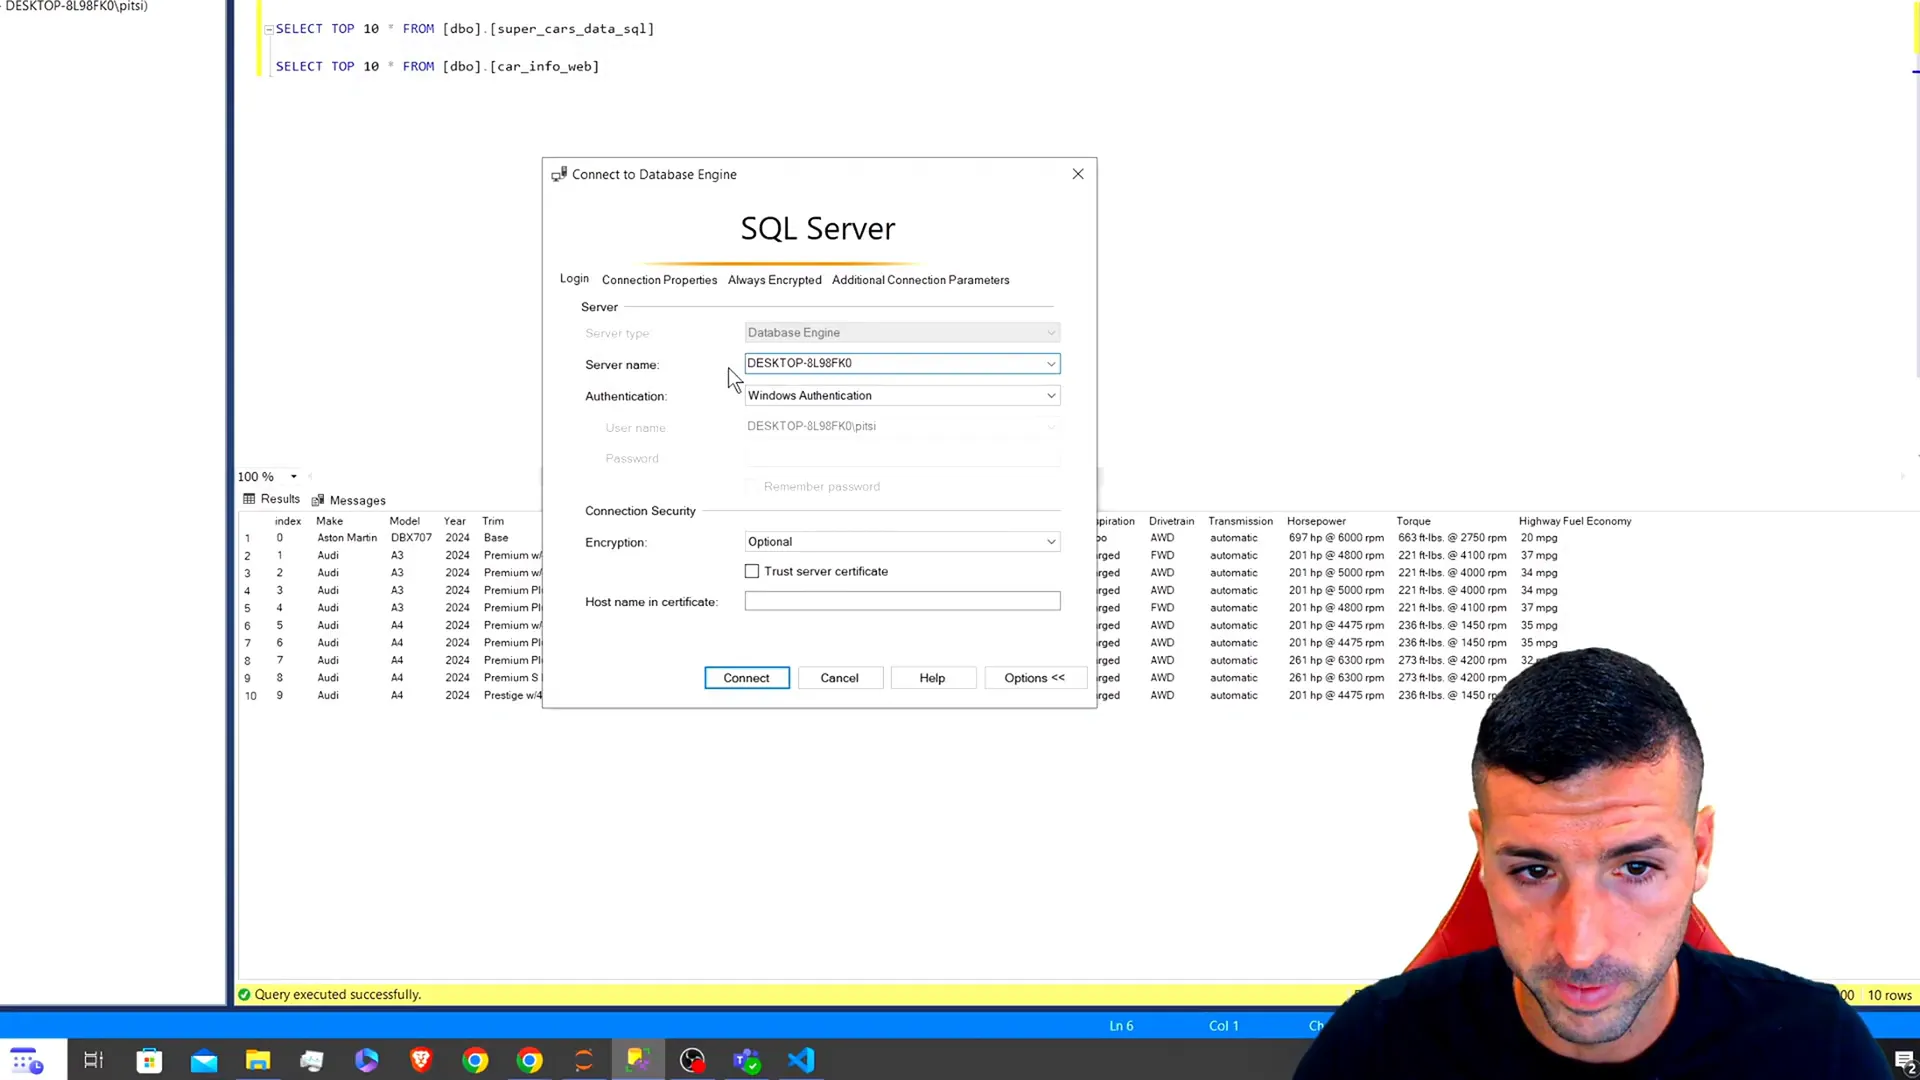
Connecting to SQL Server
Here’s how you can create a connection to your SQL server:
connection = pyodbc.connect('DRIVER={SQL Server};SERVER=your_server;DATABASE=your_database;Trusted_Connection=yes;')
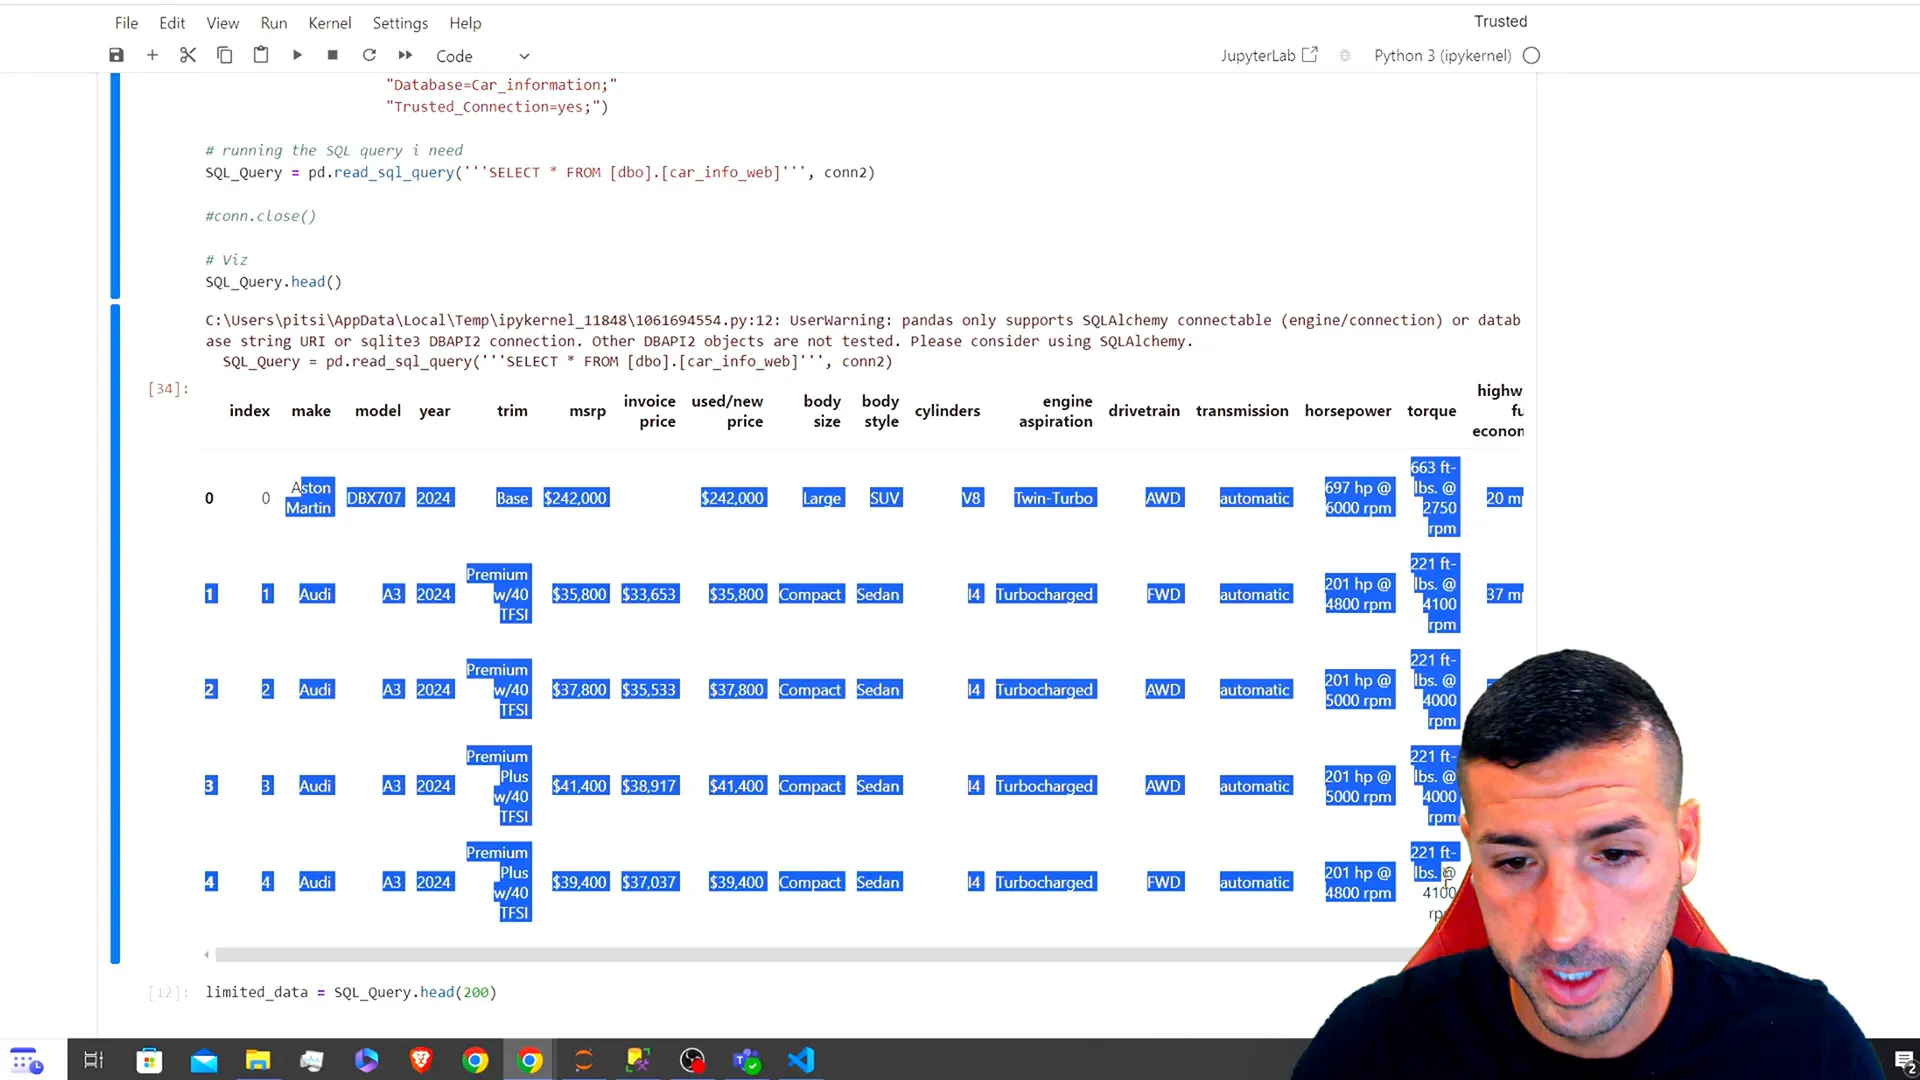
After executing this, you can run a query to fetch data:
query = "SELECT * FROM car_information"
data = pd.read_sql(query, connection)
By running this code, you should see your data displayed. If you’re looking to use the same dataset, check out my previous video where I web scrape this data and store it in SQL Server.
Limiting Data for LLM Compatibility
One important aspect of working with LLMs is that they have token limits. To avoid errors, we must limit the amount of data we send to the model. This can be done by either allowing users to input their SQL queries or by filtering specific brands.
Next, we initialize the GROQ client:
import groq

# Initialize the GROQ client
client = groq.Client(api_key='your_api_key')
Make sure you sign up on the GROQ website for a free API key if you haven’t already.
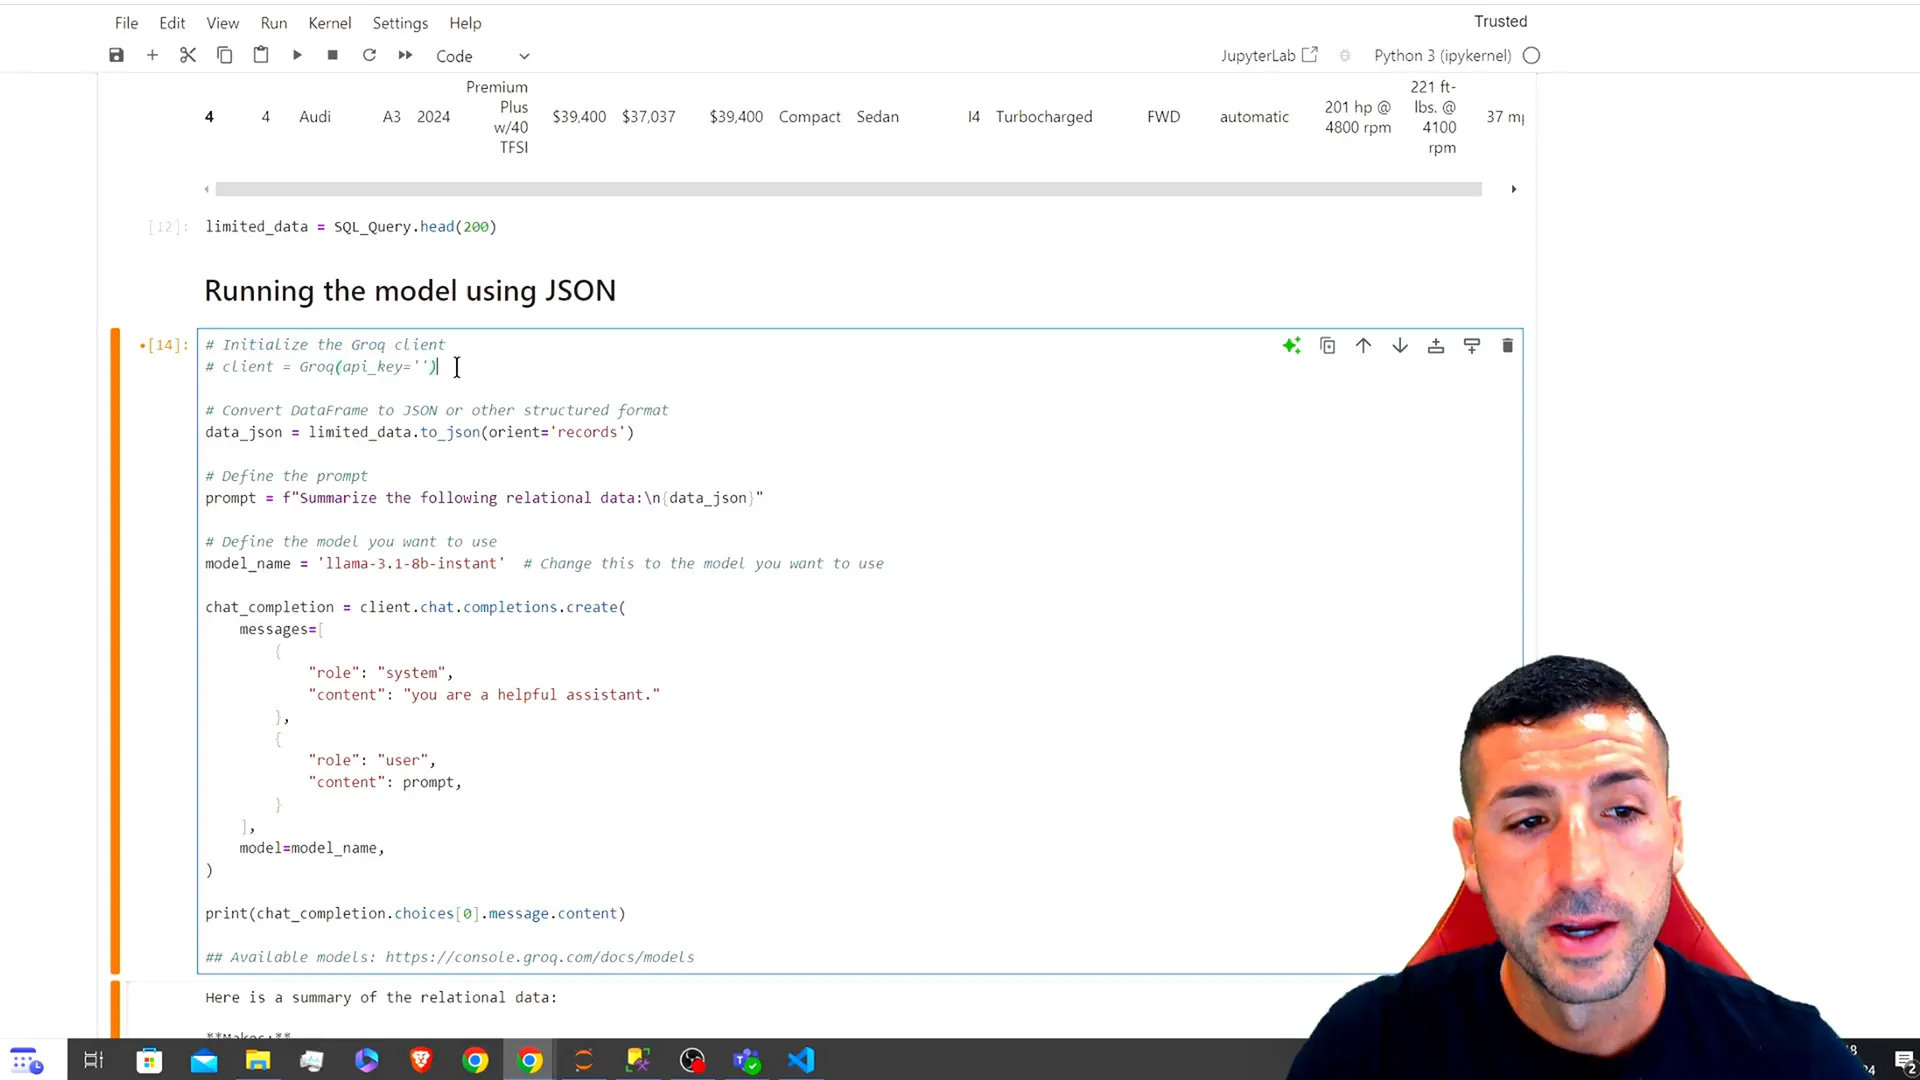
Transforming Data for LLM Understanding
After limiting our data to a manageable size, we convert it into a JSON format that LLMs can understand:
json_data = data.head(200).to_json(orient='records')
This transformation helps the LLM summarize and analyze the relational data effectively.
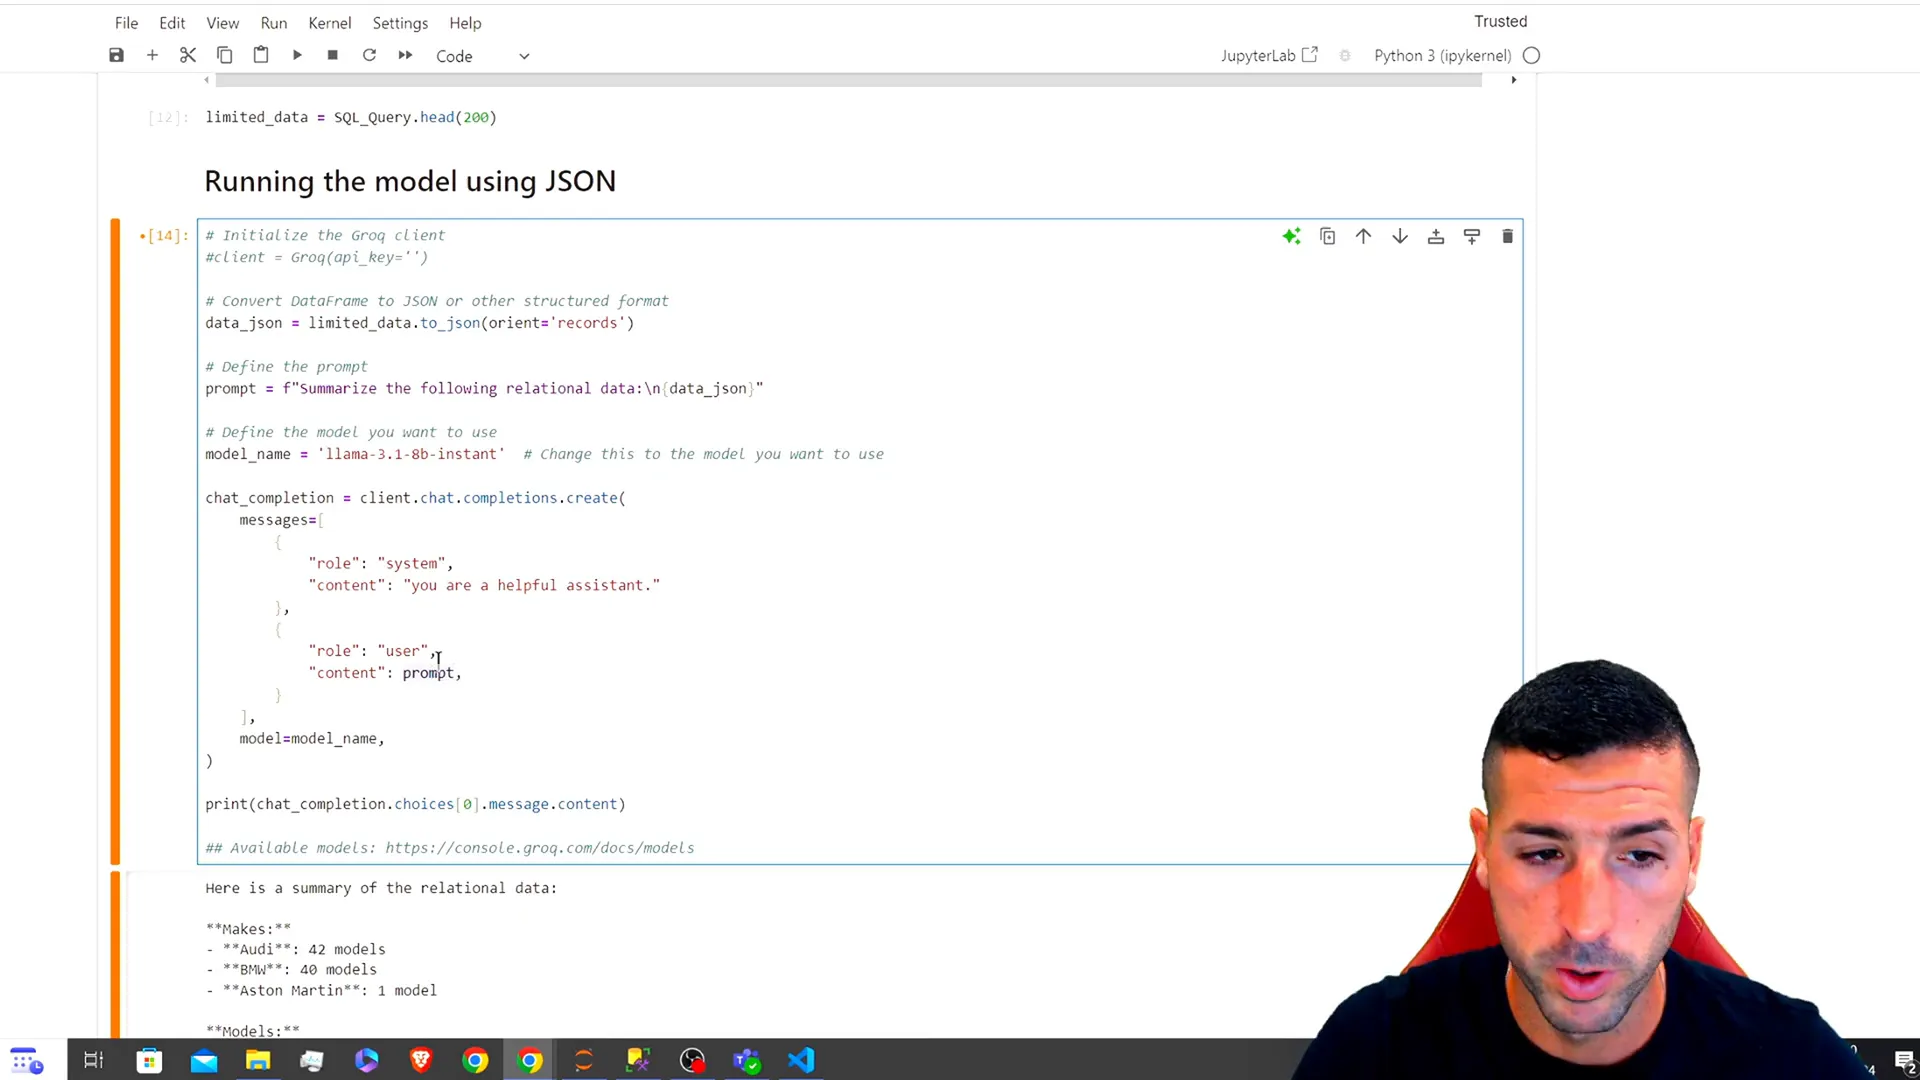
Summarizing Data with LLMs
Now, let’s define our prompt for the LLM. We’ll ask the model to summarize the relational data:
prompt = "Summarize the following relational data: " + json_data
response = client.completions.create(prompt=prompt, model='instant')
summary = response['choices'][0]['text']
print(summary)
This code will provide a summary of the data, detailing the make and model of the cars, along with their specifications.
Creating the First Streamlit App
Let’s now encapsulate our code into functions and build our first Streamlit app. Start by organizing your code:
import streamlit as st

def connect_to_sql(server, database):
    connection_str = f'DRIVER={{SQL Server}};SERVER={server};DATABASE={database};Trusted_Connection=yes;'
    return pyodbc.connect(connection_str)

def fetch_data(connection, query):
    return pd.read_sql(query, connection)
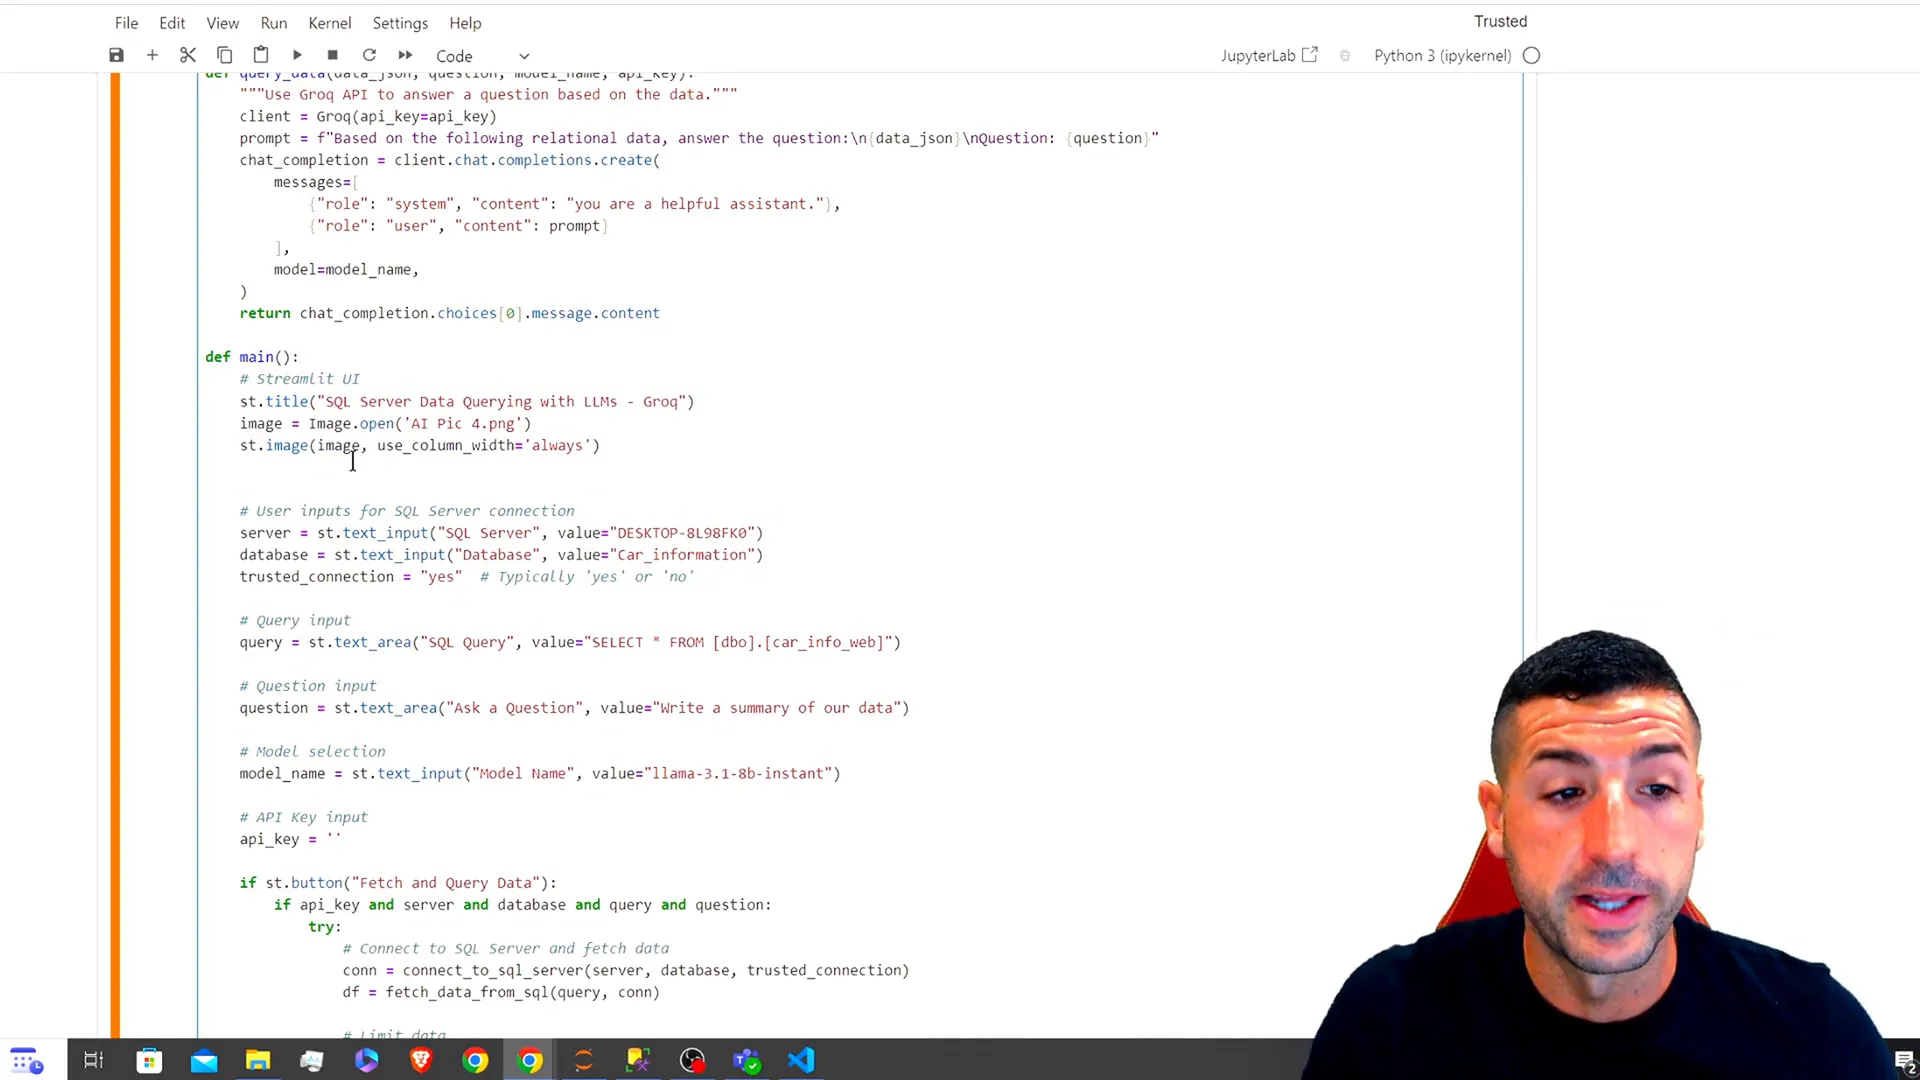
Next, create the main function for your Streamlit app:
def main():
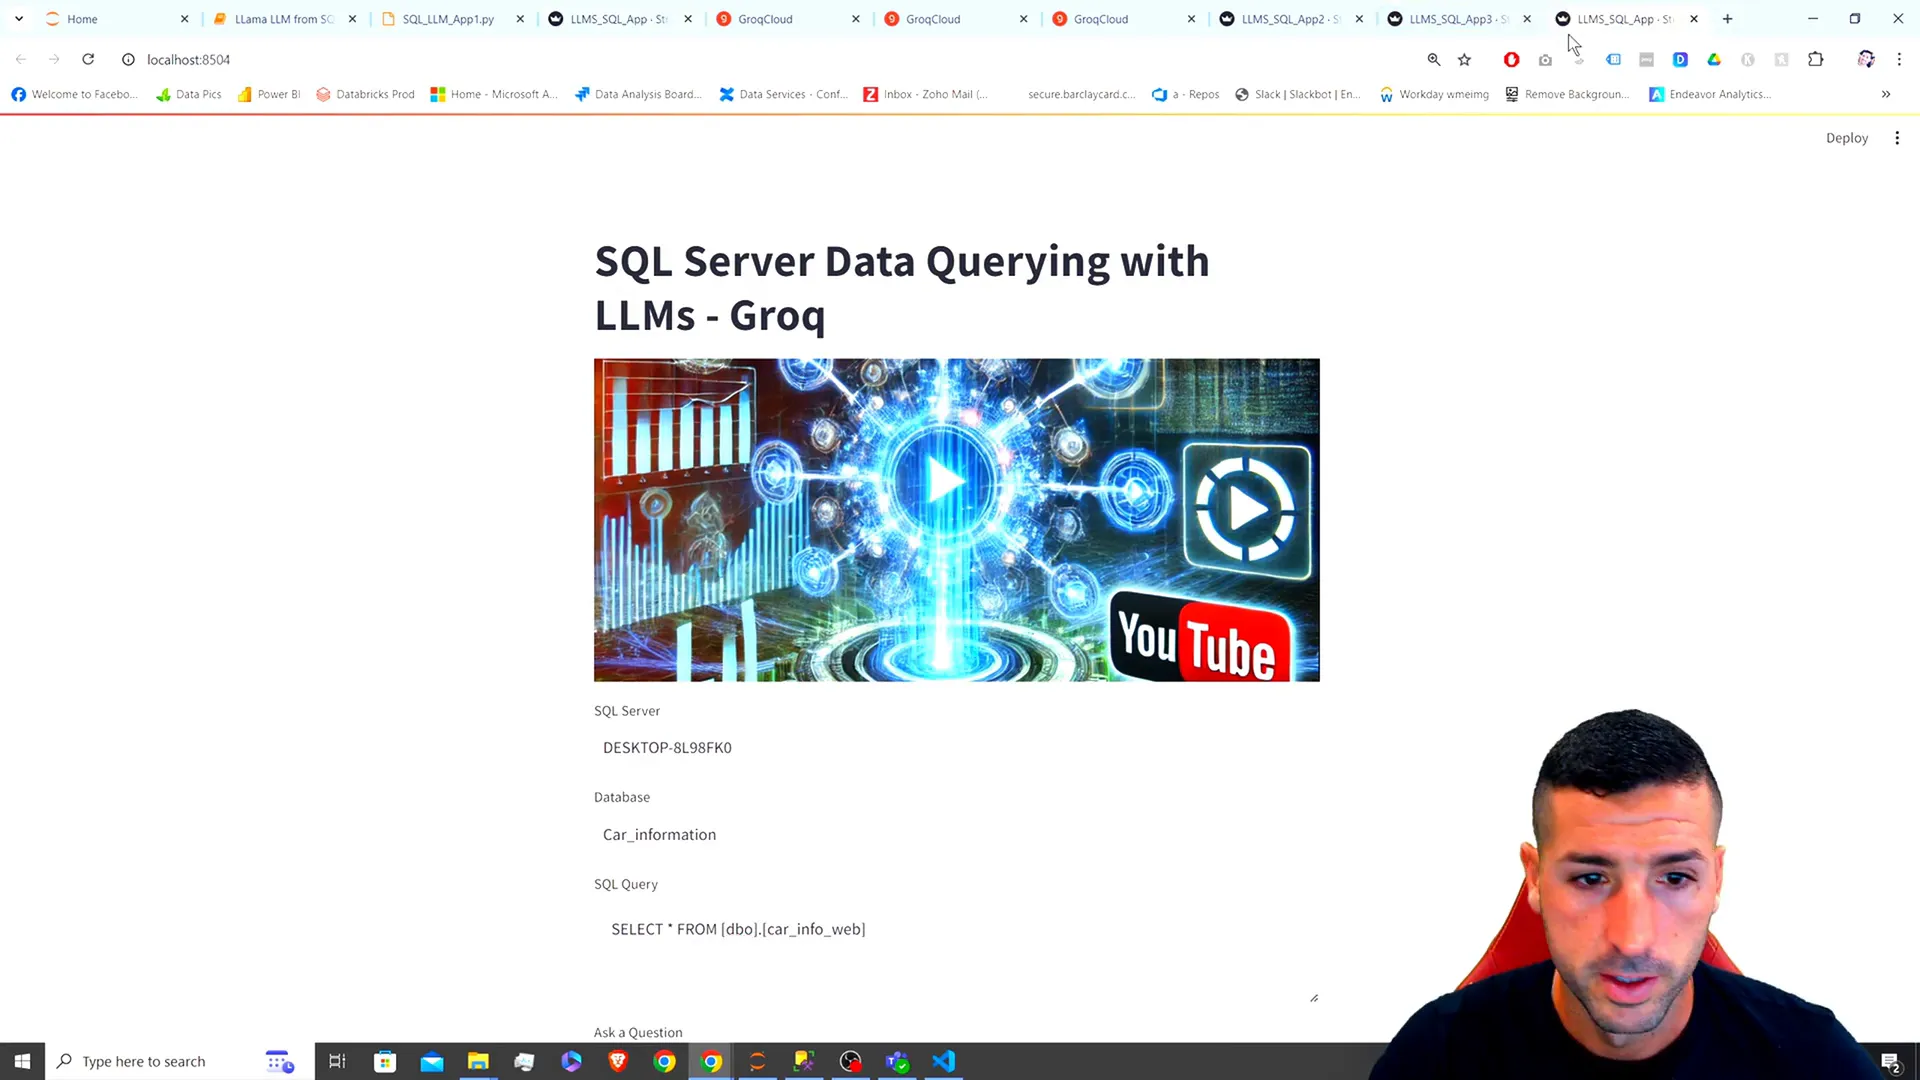
st.title("SQL Server Data Querying with LLMs")
server = st.text_input("Server")
database = st.text_input("Database")
query = st.text_area("SQL Query", "SELECT * FROM car_information")
if st.button("Fetch Data"):
conn = connect_to_sql(server, database)
data = fetch_data(conn, query)
st.write(data)
Run this function in your Streamlit app to display the data fetched from SQL.
Deploying the First App
To deploy your Streamlit app, save your script as a .py file and run the following command in your terminal:
streamlit run your_script.py
This command will launch your app in a new browser tab, allowing you to interact with your SQL data directly.
Enhancing the Streamlit App
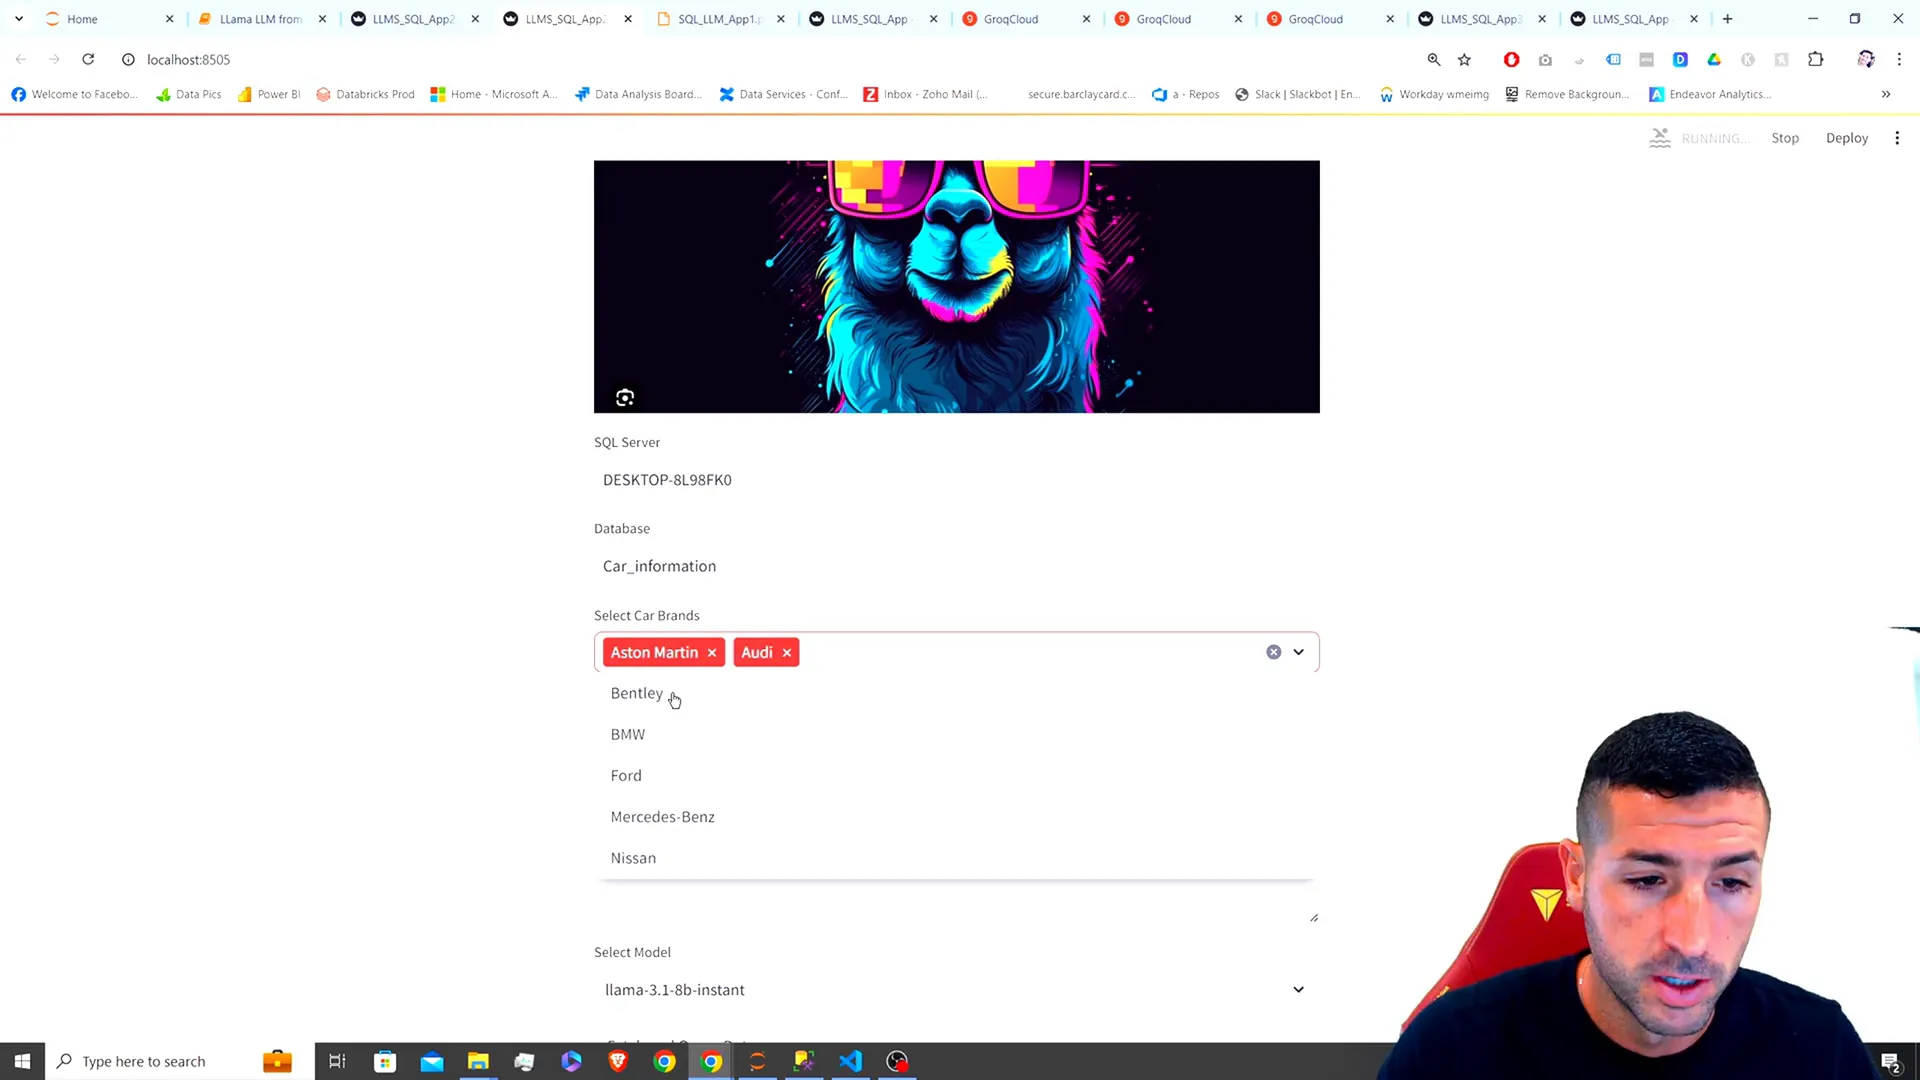
Now, let’s enhance our app by allowing users to filter data by specific brands and limit the number of records displayed. This is crucial for efficient data handling.
We will add a multi-select box for brands and a slider to control the number of records:
brands = st.multiselect("Select Brands", options=["Mercedes", "Audi", "Nissan"])
num_records = st.slider("Number of Records", min_value=10, max_value=2000, value=200)
Integrate these features into your fetching logic to ensure users can customize their queries effectively.
Creating the Second and Third Apps
For the second app, we’ll maintain similar functionality but with additional features like model selection. Copy your first app code, make necessary changes, and add a selection box for different LLM models.
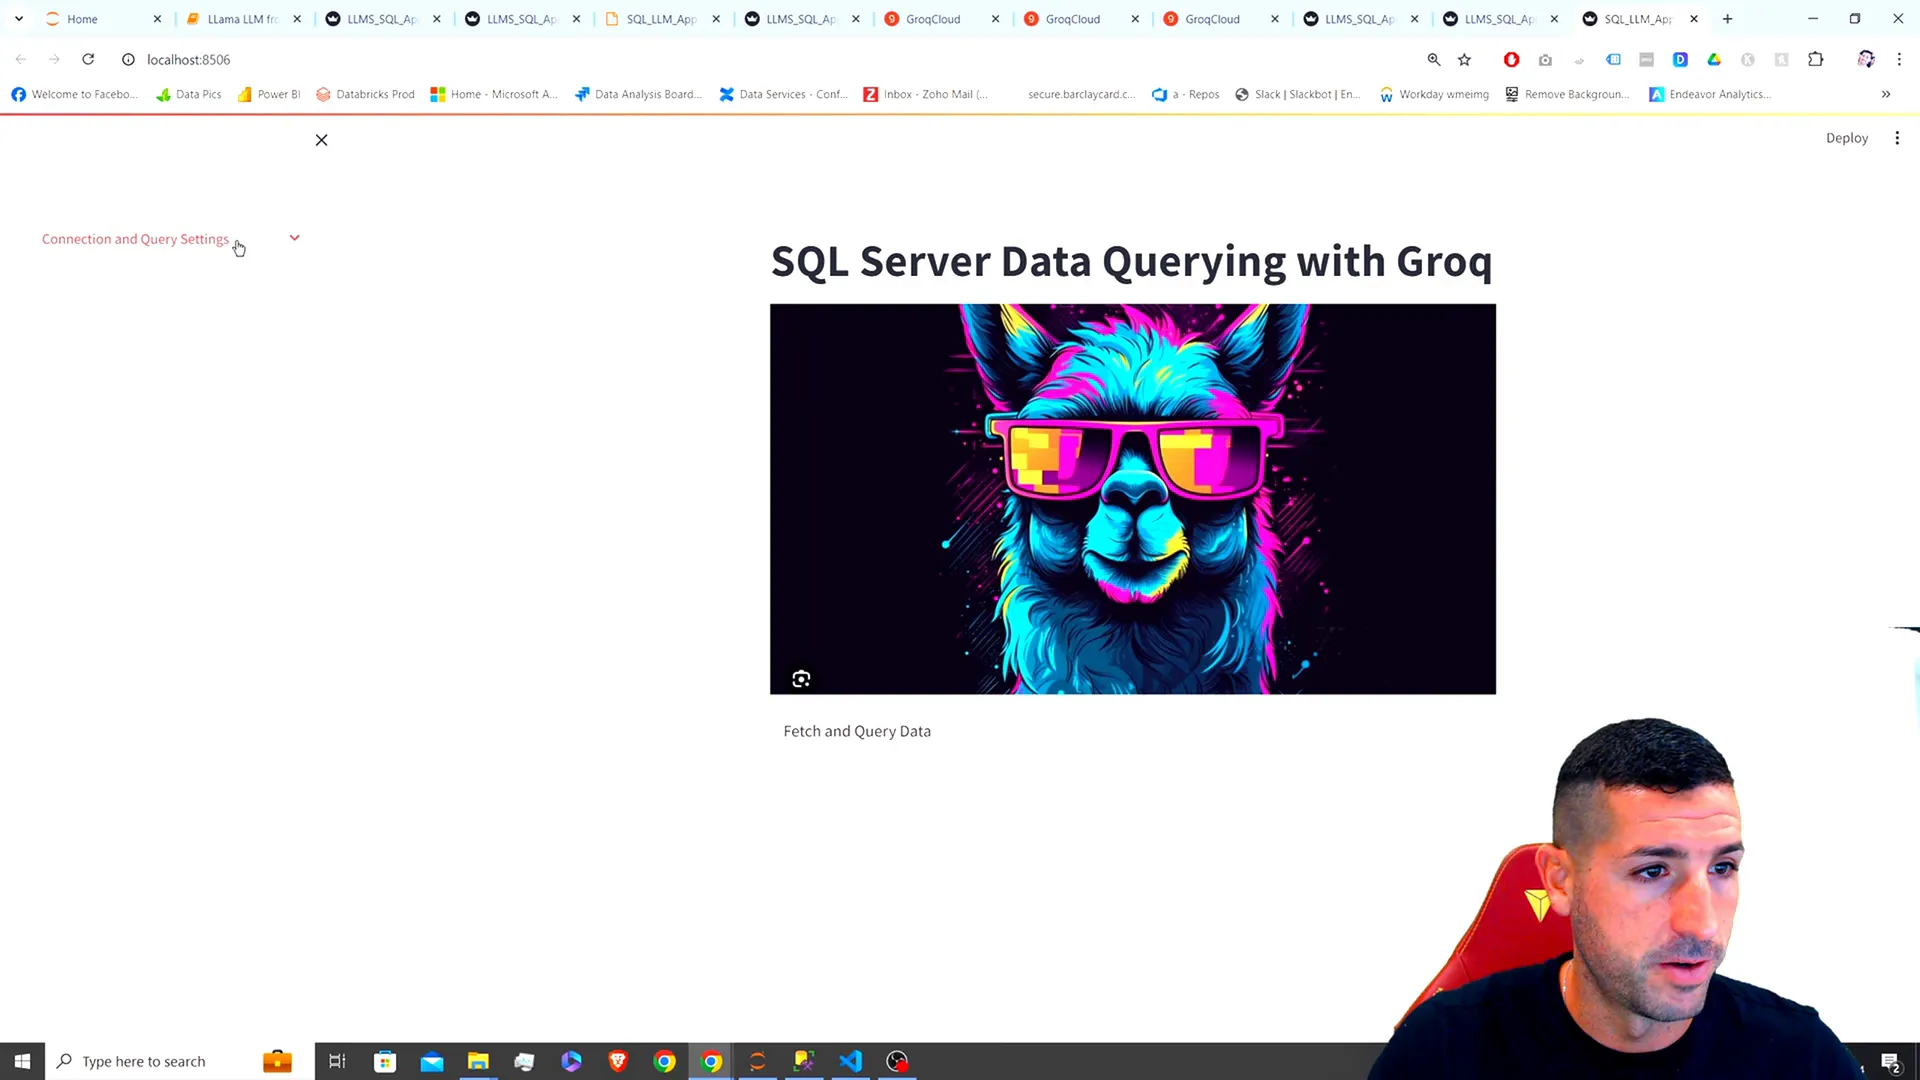
For the third app, focus on aesthetic changes by moving settings to a sidebar for a cleaner interface:
with st.sidebar:
    st.title("Connection Settings")
    server = st.text_input("Server")
    database = st.text_input("Database")
    # Other settings...
This modification will improve user experience and make the app more intuitive.
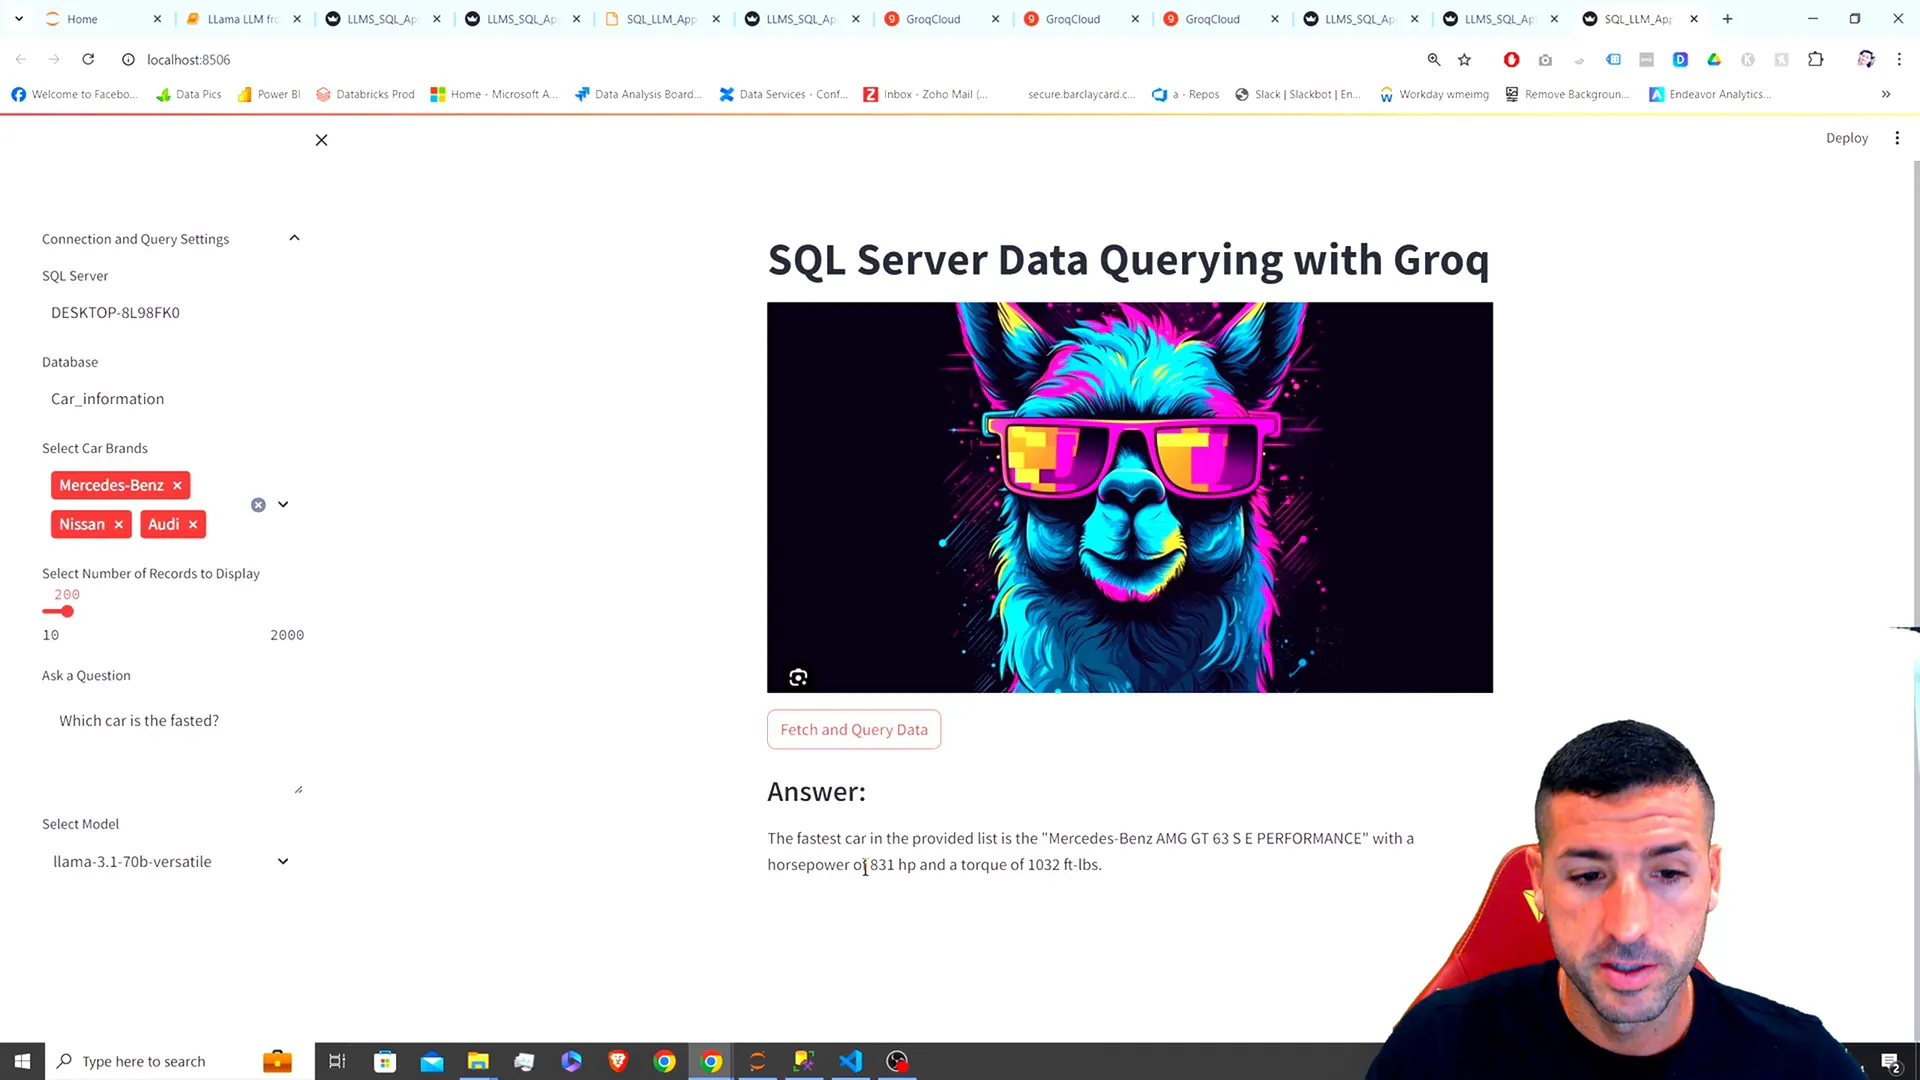
Testing the Final App
After implementing all features, it’s time to test your final app. Input different queries, select brands, and observe how the app responds. For example, try asking:
"Which car is the fastest?"
The LLM should provide a detailed response based on the filtered data.
Conclusion
You’ve now built a fully functional Streamlit app that leverages LLMs to analyze SQL data using natural language queries. This powerful combination allows users to gain insights from relational data in an accessible manner. If you found this tutorial helpful, please like, subscribe, and enable notifications for future updates!
If you have any questions or suggestions for future topics, feel free to leave a comment below. Happy coding!
For the complete source code, check out my GitHub repository.
Connect with me on X for more updates!